LAKE COUNTY, Calif. — After a two-year hiatus due to the pandemic, the Purple Power Walk is returning to bring awareness and recognition for Domestic Violence Awareness Month.
Lake Family Resource Center will host the sixth annual walk on Saturday, Oct. 22, at 5350 Main St. in Kelseyville.
The event will begin at 9 a.m. and will take place, rain or shine, with participants wearing purple as they walk through town.
Lake Family Resource Center Victim Services Program Director Sheri Young said the purpose of the walk is to honor those who survived, to mourn those who have been lost and to join advocates, partners and community members throughout Lake County through visual awareness.
Those suffering as a result of domestic violence and needing help can call or text the community crisis line around the clock, seven days a week, by calling or texting 888-485-7733.
For more information about the Purple Power Walk, call 707-279-0563 or email This email address is being protected from spambots. You need JavaScript enabled to view it..
The national poverty rate was 12.8% in 2021, but was significantly different for the nation’s oldest and youngest populations, according to a new Census Bureau report released today.
The child poverty rate (for people under age 18) was 16.9% in 2021, 4.2 percentage points higher than the national rate, while poverty for those ages 65 and over was 10.3%, 2.5 percentage points lower than the national rate.
The American Community Survey (ACS) 1-year estimates provide data for a number of demographic, social and economic indicators, including poverty. The estimates are used by planners, policymakers and community stakeholders to evaluate trends and make comparisons across demographic groups.
Government agencies, researchers and local organizations regularly use these estimates to measure economic well-being and identify the number of individuals and families eligible for various programs.
How poverty is measured
Poverty status is determined by comparing annual income to a set of dollar values (called poverty thresholds) that vary by family size, number of children and the age of the householder.
If a family’s pre-tax income is less than the dollar value of their threshold, that family and every member are considered to be in poverty. For people not living in families, poverty status is determined by comparing the individual’s income to their poverty threshold.
The poverty measure excludes children under the age of 15 who are not related to the householder, people living in institutional group quarters – such as correctional facilities and nursing homes – as well as people living in college dormitories or military barracks.
Child poverty by state, region and metro
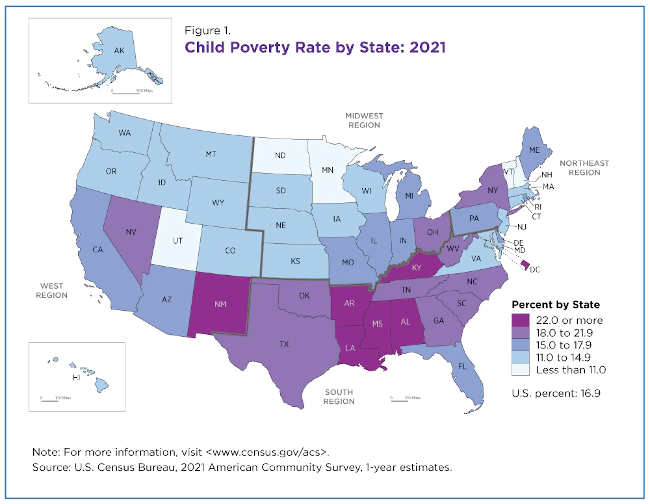
The national child poverty rate was 16.9% but there was considerable variation among states, ranging from 8.1% to 27.7%.
Figure 1 illustrates the uneven geographic distribution of child poverty in every state and the District of Columbia.
Three-quarters of states in the South region (12 states) and the District of Columbia had child poverty rates of at least 18.0%.
The Midwest and Northeast each had only one state with child poverty rates of at least 18.0% and the West had two.
Child poverty rates by state:
• Among the lowest were Utah (8.1%) and New Hampshire (9.2%). (These estimates are not significantly different from one another.) • Among the highest were Mississippi (27.7%), Louisiana (26.9%) and the District of Columbia (23.9%). (These estimates are not significantly different from one another.)
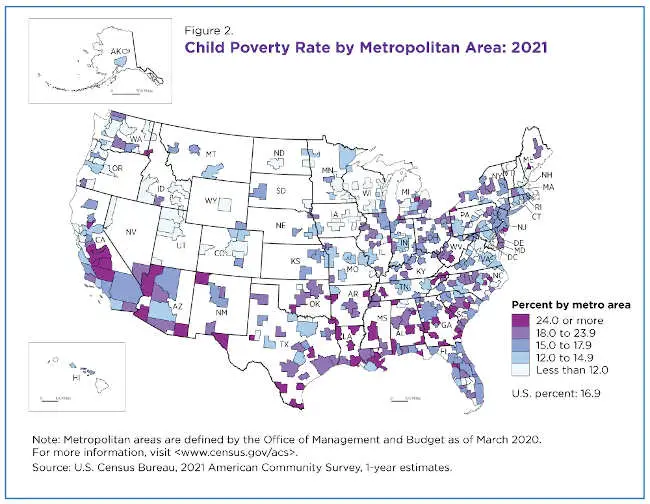
Child poverty rates also varied widely – from 2.1% to 39.2% – among the nation’s 384 Metropolitan Statistical Areas or metro areas in 2021 (Figure 2).
Forty-one (69.5%) of the 59 metro areas with the nation’s highest child poverty rates were in the South and accounted for 26.3% of all of the region’s 156 metro areas.
In contrast, only 5.1% of metro areas in the highest child poverty rate category were in the Northeast and the Midwest, and 20.3% in the West. More than a third (31 of 86) of the metro areas in the lowest child poverty category were in the West; these metro areas accounted for over 35% of the region’s total metro areas.
Poverty rate for people ages 65 and over
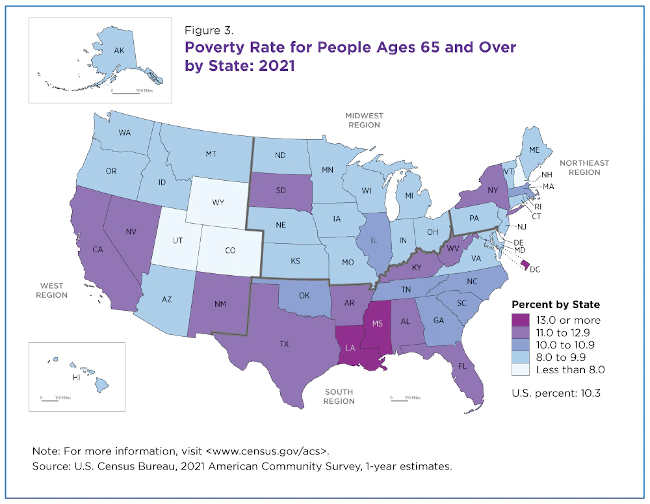
In 2021, the national poverty rate for people ages 65 and over was 10.3%, significantly lower than the poverty rate for all people and the child poverty rate.
There were geographic variations in these poverty rates though not as pronounced as for the child poverty rate. The poverty rates for the older population ranged from 6.7% to 14.1% (Figure 3).
The South had eight states and the District of Columbia with poverty rates of 11.0% or more. No other region had more than three states with such high poverty rates for the 65-plus population.
Ages 65 and over poverty rates by state:
Among the lowest: Wyoming (6.7%), New Hampshire (6.9%), Delaware (6.9%), Utah (7.7%), and Colorado (7.7%). (These estimates are not significantly different from one another.) Among the highest: Louisiana (14.1%), the District of Columbia (13.8%), Mississippi (13.8%) and New Mexico (12.8%). (These estimates are not significantly different from one another.)
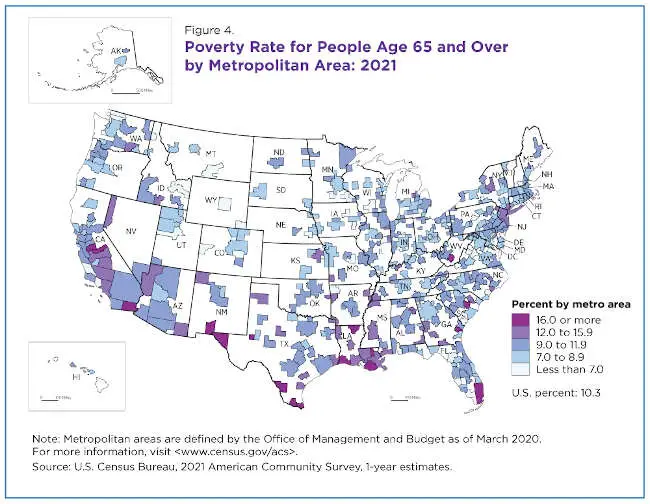
There were even greater variations in the poverty of the older populations between metro areas – from 3.1% to 31.6% (Figure 4).
The majority (276 or 71.9%) of the nation’s 384 metro areas had poverty rates for people ages 65 and over that fell into two categories on the map: 7.0%-8.9% and 9.0%-11.9%.
Of the 61 metro areas with poverty rates at 12.0% or higher for people ages 65 and over, 53 were in the South (39) or the West (14). The South had 25% of all its metro areas in the two highest poverty categories compared to just 5.4% of those in the Midwest.
Additional poverty data from the 2021 release and links to poverty estimates from other surveys such as the Current Population Survey Annual Social and Economic Supplement (CPS ASEC) and the Survey of Income and Program Participation (SIPP) are available on this topics page.
Craig Benson is a survey statistician in the Census Bureau’s Poverty Statistics Branch.
LAKE COUNTY, Calif. — The community is invited to join Mother-Wise and Hospice Services of Lake County in an evening of remembrance as they participate in the global Wave of Light on Saturday, Oct. 15.
The evening is set aside to remember all babies lost to miscarriage, stillbirth and neonatal death.
Pregnancy and childbirth are usually joyous, happy and busy times. But when things don’t go as hoped or planned, when the unthinkable happens, families are left with the unimaginable devastation and profound grief that surrounds the loss of a baby.
In 1988 when President Ronald Reagan designated October as national Pregnancy and Infant Loss Awareness Month, he noted that, “When a child loses his parent, they are called an orphan. When a spouse loses her or his partner, they are called a widow or widower. When parents lose their child, there isn’t a word to describe them.”
This is still true, despite the fact that October was set aside to “recognize the loss so many parents experience across the U.S. and around the world.”
Oct. 15 was chosen as a day of remembrance throughout the world.
Since 2003, the global Wave of Light has served as an opportunity for bereaved parents, family and friends to commemorate their babies by lighting a candle at 7 p.m. in their local time zone and leaving it burning for at least one hour.
The result is a continuous “wave of light” spanning the globe for a 24-hour period in remembrance of all loved and longed for babies gone too soon.
Mother-Wise supports Lake County’s expecting and new moms through all transitions that accompany motherhood, including loss, with weekly topic-oriented groups, individualized supportive services, and community resources.
The organization has participated in this special day of remembrance to coincide with similar events worldwide since 2014.
Whether you have endured a loss yourself, or love someone who has, whether this loss was recent or long ago, all are welcome to join in the event.
Participants will meet at Library Park, located at 200 Park St. in Lakeport, and the event will take place from 6 to 8 p.m.
Light refreshments will be offered, as well as community speakers, and remembrance activities. Candles will be provided and lit at 7 p.m.
For any questions, or to RSVP, please contact Mother-Wise at 707-349-1210.
LAKE COUNTY, Calif. — The Lake County Association of Realtors’ latest report on home sales shows drops both in numbers of homes sold and overall pricing in September.
Over the month of September, the total homes sold through the multiple listing service totaled 94, compared to 99 during the same time last year.
The homes sold include traditionally built “stick-built” houses as well as manufactured homes on land.
There were five sales of mobile homes in parks compared to six for the same time last year, and 27 bare land — lots and acreage — sales, compared with 38 for the same time last year.
Total percentage of homes bought for all cash in September was 34%, compared to 23% for the same time last year.
Of those, 36% were financed by Fannie Mae or Freddie Mac (“conventional loans”) compared to 55% for the same time last year; 20% were financed by FHA (same as last year this time); and 3% were financed by the VA or CalVet (unchanged from this time last year); 6% had other financing such as private loans or seller financed notes (compared to 9% last year at this time).
There are 416 homes on the market right now. If the rate of sales stays the same at 94 homes sold per month, there are 4.4 months of inventory on the market at the moment compared to 5.2 months of inventory a month ago. That means that if no new homes are brought to the market for sale, in 4.4 months all of these homes would be sold and there would be none available.
Less than six months of inventory is generally considered to be a “sellers’ market” while more than six months of inventory is often called a “buyers’ market.”
The inventory had been growing steadily from March through August, but last month stopped that trend.
Most homes were selling very close to the asking price, at an average of 96% of the asking price.
This is in contrast to other areas, where homes sell for more than the asking price.
The median time on the market last month was 32 days, compared to 20 days for this time last year.
The median sale price of a single family home in Lake County over the last 30 days was $282,500, a drop from last month’s $300,000, and lower than $350,000 during this time period last year.
In the past 30 days, 33% of homes sold had seller concessions for an average of $8,201; a year ago, 24% of homes sold had an average seller concession of $5,991.
A more detailed breakdown by the different areas is below.
State Controller Betty T. Yee has published the 2021 self-reported payroll data for University of California institutions and California Community College districts on the Government Compensation in California website.
The data cover more than 404,000 positions and approximately $23.94 billion in total wages.
Users of the site can view compensation levels on maps and search by region; narrow results by name of the entity or by job title; and export raw data or custom reports.
All 11 UC institutions — including 10 campuses and the Office of the President — voluntarily filed compliant reports with the State Controller’s Office (SCO). UC data cover 299,448 employees and more than $19.19 billion in total wages.
Forty-four CCC districts voluntarily filed compliant reports with SCO. CCC data published cover 104,856 employees and more than $4.74 billion in total wages.
Fourteen CCC districts did not file a report with SCO, while another 14 filed reports that were not compliant.
Among those districts which did not file are the two districts serving Lake County: the Mendocino-Lake Community College District and the Yuba Community College District.
California law requires cities, counties, and special districts to annually report compensation data to the State Controller.
The state controller also maintains and publishes state and CSU salary data. No such statutory requirement exists for UC, CCCs, superior courts, fairs and expositions, First 5 commissions, or K-12 education providers; their reporting is voluntary.
Since the website launched in 2010, it has registered more than 14 million pageviews. The site contains pay and benefit information on more than two million government jobs in California, as reported annually by each entity.
As the chief fiscal officer of California, Controller Yee is responsible for accountability and disbursement of the state’s financial resources. The controller has independent auditing authority over government agencies that spend state funds. She is a member of numerous financing authorities, and fiscal and financial oversight entities including the Franchise Tax Board. She also serves on the boards for the nation’s two largest public pension funds.
The California Highway Patrol will implement a yearlong federal grant to help save lives and reduce the risk associated with riding a motorcycle.
The goal of the Get Educated and Ride Safe, or GEARS, V grant is to decrease the number of motorcycle-involved crashes and victims through education and enforcement efforts across California through Sept. 30, 2023.
From Oct. 1, 2020, to Sept. 30, 2021, there were 7,078 motorcycle-involved crashes resulting in 354 deaths and 6,400 injuries within CHP jurisdiction, an increase of 3% over the previous 12 months.
“Motorcycle riders are statistically more likely to be injured or killed when involved in a crash,” said CHP Commissioner Amanda Ray. “In an effort to ensure every motorist reaches their destination safely, the CHP will continue to use enforcement and nonenforcement strategies, including education and community engagement, to target the leading causes of traffic deaths.”
During the grant period, the CHP will participate in traffic safety education efforts, such as “May is Motorcycle Safety Awareness Month.”
These campaigns will promote the use of U.S. Department of Transportation-compliant helmets for all riders and raise driver awareness of sharing the road with motorcyclists.
The CHP will also increase enforcement in areas with a high number of motorcycle-involved crashes, which resulted from speed, improper turns, and driving under the influence of alcohol and/or drugs.
Funding for this program was provided by a grant from the California Office of Traffic Safety, through the National Highway Traffic Safety Administration.
The mission of the CHP is to provide the highest level of safety, service and security.
In a partnership spanning more than 90 years, the California Department of Forestry and Fire Protection with the National Fire Protection Association — the official sponsor of Fire Prevention Week — unite to promote this year’s Fire Prevention Week campaign, “Fire won’t wait. Plan your escape.”
Fire Prevention Week this year is Oct. 9 to 15.
This year’s theme brings quick action safety measures front of mind for residents to utilize in the event of a home fire.
Cal Fire urges all residents to incorporate this year’s Fire Prevention Week theme because homes can burn fast. In some instances, you may have as little as two minutes or less to safely escape a home fire once the smoke alarm sounds.
After all, you plan for vacations, holidays, and weekly meals, why not plan to save your life and those around you in the event of a home fire?
“Too many lives are lost in home fires each year in California,” said State Fire Marshal Chief Mike Richwine. “According to a newly-released National Fire Protection Association report, U.S. home fire deaths hit a 14-year high last year, marking the critical importance of Fire Prevention Week and the reminder to plan and practice a home fire escape so that action can be taken when the smoke alarm sounds.”
There are two key factors critical to safely escaping a home fire: early warning from smoke alarms and advance planning.
Accordingly, this year’s Fire Prevention Week concept offers a blueprint to guide you and yours safely and swiftly out of a home fire. Invest a little time now so that you and yours are ready for the fire that won’t wait.
Some action items you can take to equip your home and plan your escape are:
• Make the first Saturday of each month “Smoke Alarm Saturday” - a working smoke alarm will clue you in that there is a fire, and you need to escape. • Strategically install smoke alarms in every sleeping room, outside each sleeping area, every level of the home and the basement. • Test the alarms regularly by pressing the test button and change the battery if there’s no sound or the sound is low. If your smoke alarm chirps, change the battery immediately. • Develop a home fire escape plan and rehearse it with all family members at least twice a year! • Map the escape route including windows and doors—make sure the route is free of obstacles. • Predetermine an outside meeting place that’s a safe distance in front of your home. • Everyone should know the fire department’s emergency number and how to call when they’re safely outside.
For more information about Fire Prevention Week and general fire prevention practices, visit www.fpw.org.
LAKE COUNTY, Calif. — Lake County Animal Care and Control has several more kittens now ready to be adopted.
Call Lake County Animal Care and Control at 707-263-0278 or visit the shelter online at http://www.co.lake.ca.us/Government/Directory/Animal_Care_And_Control.htm for information on visiting or adopting.
The following cats at the shelter have been cleared for adoption.
“Mom” is a 2-year-old female domestic shorthair cat in kennel No. 3, ID No. LCAC-A-4080. Photo courtesy of Lake County Animal Care and Control. ‘Mom’
“Mom” is a 2-year-old female domestic shorthair cat with an orange and white coat.
She is in kennel No. 3, ID No. LCAC-A-4080.
“Mama” is a 2-year-old domestic shorthair cat in cat room kennel No. 7, ID No. LCAC-A-3884. Photo courtesy of Lake County Animal Care and Control. ‘Mama’
“Mama” is a 2-year-old domestic shorthair cat with an all-black coat.
She is in cat room kennel No. 7, ID No. LCAC-A-3884.
This 2-year-old female domestic shorthair cat is in cat room kennel No. 10, ID No. LCAC-A-3661. Photo courtesy of Lake County Animal Care and Control. Female domestic shorthair
This 2-year-old female domestic shorthair cat has a gray tabby coat.
“She is an adult cat with some playful kitten tendencies when toys are brought out. She has a sweet little meow and likes to have playful chats with you,” shelter staff said.
She is in cat room kennel No. 10, ID No. LCAC-A-3661.
This 3-year-old male domestic shorthair cat is in cat room kennel No. 13, ID No. LCAC-A-4021. Photo courtesy of Lake County Animal Care and Control. Male domestic shorthair
This 3-year-old male domestic shorthair cat has an orange tabby coat.
“This guy can be shy at first, but once he knows that you are all about the pets, he will roll right over and start his purr machine. He has a unique curly tail which he flicks around when curious,” shelter staff said.
He is in cat room kennel No. 13, ID No. LCAC-A-4021.
This 2-month-old male domestic shorthair kitten is in cat room kennel No. 36A, ID No. LCAC-A-4081. Photo courtesy of Lake County Animal Care and Control. Male domestic shorthair kitten
This 2-month-old male domestic shorthair kitten has a white coat and blue eyes.
He is in cat room kennel No. 36A, ID No. LCAC-A-4081.
This 2-month-old male domestic shorthair kitten is in cat room kennel No. 36B, ID No. LCAC-A-4082. Photo courtesy of Lake County Animal Care and Control. Male domestic shorthair kitten
This 2-month-old male domestic shorthair kitten has a light orange coat.
He is in cat room kennel No. 36B, ID No. LCAC-A-4082.
This 2-month-old male domestic shorthair kitten is in cat room kennel No. 36C, ID No. LCAC-A-4083. Photo courtesy of Lake County Animal Care and Control. Male domestic shorthair kitten
This 2-month-old male domestic shorthair kitten has an orange coat.
He is in cat room kennel No. 36C, ID No. LCAC-A-4083.
This 1-year-old male domestic longhair cat is in kennel No. 107, ID No. LCAC-A-4023. Photo courtesy of Lake County Animal Care and Control. Male domestic longhair cat
This 1-year-old male domestic longhair cat has a black and white coat.
“This guy had a hard start, but has a lot of love to give once he warms up to you,” shelter staff said.
Staff said he also loves brushing and shows his appreciation with purring and head bumps.
He is in kennel No. 107, ID No. LCAC-A-4023.
This 2-month-old female domestic shorthair kitten is in kennel No. 129a, ID No. LCAC-A-4084. Photo courtesy of Lake County Animal Care and Control.Female domestic shorthair kitten
This 2-month-old female domestic shorthair kitten has a white coat with orange markings.
She is in kennel No. 129a, ID No. LCAC-A-4084.
This 2-month-old female domestic shorthair kitten is in kennel No. 129b, ID No. LCAC-A-4085. Photo courtesy of Lake County Animal Care and Control. Female domestic shorthair kitten
This 2-month-old female domestic shorthair kitten has a gray coat with white markings.
She is in kennel No. 129b, ID No. LCAC-A-4085.
This 2-month-old female domestic shorthair kitten is in kennel No. 129c, ID No. LCAC-A-4086. Photo courtesy of Lake County Animal Care and Control. Female domestic shorthair kitten
This 2-month-old female domestic shorthair kitten has a tortoiseshell coat.
She is in kennel No. 129c, ID No. LCAC-A-4086.
Email Elizabeth Larson at This email address is being protected from spambots. You need JavaScript enabled to view it.. Follow her on Twitter, @ERLarson, or Lake County News, @LakeCoNews.
Oil and gas prices skyrocketed following the Russian invasion of Ukraine in spring 2022, creating a global energy crisis similar to the oil crisis of the 1970s. While some countries used the price shock to accelerate the transition to cleaner sources of energy, such as wind, solar and geothermal, others have responded by expanding the production of fossil fuels.
A new study appearing this week in the journal Science identifies the political factors that allow some countries to take the lead in adopting cleaner sources of energy while others lag behind. The findings offer important lessons as many governments around the world race to reduce greenhouse gas emissions and limit the devastating impacts of climate change.
“We are really interested in understanding how national differences mediate the responses of countries to the same kind of energy challenge,” said study lead author Jonas Meckling, an associate professor of energy and environmental policy at the University of California, Berkeley. “We found that the political institutions of countries shape how much they can absorb costly policies of all kinds, including costly energy policies.”
By analyzing how different countries responded to the current energy crisis and to the oil crisis of the 1970s, the study reveals how the structure of political institutions can help or hinder the shift to clean energy. Meckling carried out the analysis in collaboration with study co-authors Phillip Y. Lipscy of the University of Toronto, Jared J. Finnegan of University College London, and Florence Metz of the University of Twente, in the Netherlands.
Because policies that promote the transition to cleaner energy technologies are often costly in the short-term, they can garner significant political pushback from constituents, including consumers and corporations. The analysis found that the countries that were most successful at pioneering cleaner energy technologies had political institutions that helped absorb some of this pushback — either by insulating policymakers from political opposition or by compensating consumers and corporations for the extra costs associated with adopting new technologies.
For example, Meckling said, many countries in continental and northern Europe have created institutions that allow policymakers to insulate themselves from pushback by voters or lobbyists or to pay off constituencies impacted by the transition. As a result, many of these countries have been more successful at absorbing the costs associated with transitioning to a clean energy system, such as investing in greater wind capacity or upgrading transmission grids.
Meanwhile, countries that lack such institutions, such as the U.S., Australia and Canada, often follow market-driven transitions, waiting for the price of new technologies to drop before adopting them.
“We can expect that countries that can pursue the insulation or compensation path will be early public investors in these very costly technologies that we need for decarbonization, such as hydrogen fuel cells and carbon removal technologies,” Meckling said. “But once these new technologies become cost competitive in the market, then countries like the U.S. can respond relatively rapidly because they are so sensitive to price signals.”
One way to help insulate policymakers from political pushback is to hand over regulatory power to independent agencies that are less subject to the demands of voters or lobbyists. The California Air Resources Board (CARB), a relatively autonomous agency that has been tasked with implementing many of California’s climate goals, is a prime example of such an institution. Thanks in part to CARB, California is often considered a global leader in limiting greenhouse gas emissions, despite being a state within the U.S.
Germany, another global climate leader, is instead using compensation to achieve its ambitious climate goals. For example, the Coal Compromise brought together disparate groups — including environmentalists, coal executives, trade unions and leaders from coal mining regions — to agree on a plan to phase out coal by the year 2038. To achieve this goal, the country will provide economic support to workers and regional economies that are dependent on coal, while bolstering the job market in other industries.
“We want to show that it's not just resource endowments that shape how countries respond to energy crises, it's also politics,” Meckling said.
The U.S., as a whole, does not have strong institutions in place to absorb political opposition to costly energy policies. However, Meckling said that policymakers can still drive the energy transition forward by leveraging the leadership of states like California by focusing on policies that have more dispersed costs and less political opposition — such as support for energy research and development — and by clearing the way for the market to adopt new technologies once the cost has gone done.
“Countries like the U.S. that do not have these institutions should at least focus on removing barriers once these clean technologies become cost competitive,” Meckling said. “What they can do is reduce the cost for market actors.”
Kara Manke writes for the UC Berkeley News Center.
Patricia Fabian, Boston University and Jonathan Levy, Boston University
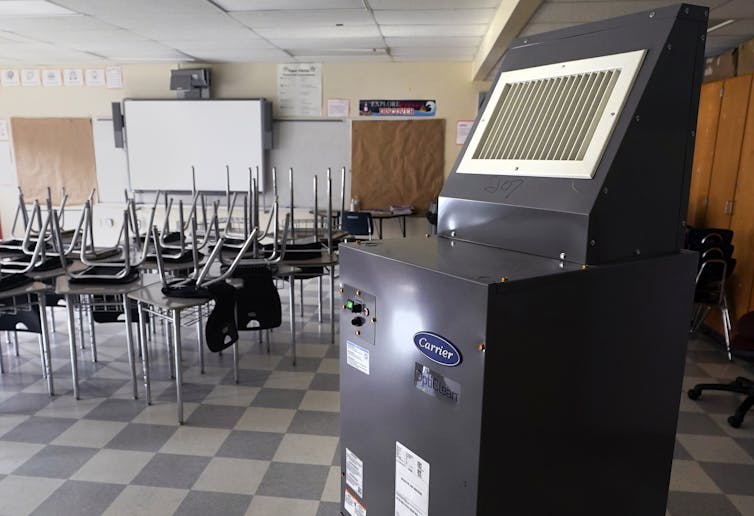
An air scrubber in a classroom at the E.N. White School in Holyoke, Mass. AP Photo/Charles Krupa
As fall temperatures cool across the U.S., many schools will struggle to ventilate classrooms while also keeping students and teachers comfortable and healthy. Children and teachers spend over six hours a day in classrooms during the school year, often in buildings that are decades old and have inadequate heating, ventilation and air conditioning, or HVAC, systems.
Fall 2022 marks the start of the fourth school year affected by the COVID-19 pandemic, which has spotlighted the importance of indoor air quality in schools. Ideally, all school buildings would have adequate ventilation, filtered air in each classroom and windows that open. Sadly, this is not the case – and indoor air quality in many schools is poor as a result. This is especially problematic in the wake of the U.S. Centers for Disease Control and Prevention’s August 2022 COVID-19 guidance for schools, which scales back other measures for limiting transmission, such as masking, testing and quarantining.
Beyond minimizing COVID-19 transmission, indoor air quality also matters for student academic performance. This is especially important given the learning losses that many children experienced in the first two years of the pandemic. Hot, stuffy classrooms make it harder for students to learn. So do cold classrooms.
Our research focuses on indoor environmentsand health – an area that has received increased attention during the pandemic, since most COVID-19 transmission occurs through shared air indoors. There is ample evidence that smart investments in school buildings can reduce transmission of infectious disease, while also improving learning and increasing well-being for students, teachers and administrators.
Many school districts have limited resources and buildings in poor condition. Where should they start? Here are some priorities we see for immediate action and longer-term investments that can truly transform the school experience.
Filters and fresh air
Since the spring of 2020, schools have invested millions of dollars in interventions to reduce COVID-19 transmission, including high-efficiency, free-standing commercial filter units and ventilation upgrades. These actions are a drop in the bucket, given the structural improvements needed in many schools, especially in less wealthy school districts, but they are an important start. And their benefits extend beyond COVID-19, so they should not be discarded.
Schools with mechanical ventilation have been able to increase the amount of filtered fresh air that these systems pull indoors. This dilutes all indoor pollutants. For kids and school staff, particularly those with asthma, allergies and sensitivities, this can mean fewer missed days of school, less medication, and fewer asthma attacks and subsequent trips to the hospital.
Improved ventilation can actually increase learning and attention. A 2010 study showed that kids performed better on standardized tests when ventilation rates were higher. Poor ventilation may also affect teachers: A 2016 study found that office workers’ cognitive performance improved when they were exposed to lower carbon dioxide levels, which is a marker of better ventilation. And a 2018 analysis showed that students’ performance on school tests declined on hot days, especially in schools without air conditioning. If you’ve ever felt that it was hard to concentrate in a hot, stuffy room, the science backs you up.
For now, we recommend that schools that have put improvements in place should maintain increased ventilation rates with maximum fresh air, continue to use high-efficiency filters in their HVAC systems and keep free-standing filters running in classrooms. Schools that have not invested in these steps should do so, with states providing funding to lower-resourced districts as needed. The costs of these steps are modest compared with the benefits they provide for health and learning.
Families and staff who want to improve conditions in their schools should focus on providing every classroom with improved ventilation and filtration, including building DIY boxes, if necessary.
A Corsi-Rosenthal Box is a homemade air cleaning system that can reduce indoor exposure to airborne particles containing the virus that causes COVID-19. It can also reduce the levels of other particles in the air, such as dust or wildfire smoke.
Funding for healthier buildings
These near-term solutions can help, but the best way to ensure that schools provide healthy conditions for learning is by investing in healthier buildings.
Funds for this purpose are available now. All U.S. states have received millions of dollars from the American Rescue Plan, enacted in 2021 to address the impact of COVID-19, including Elementary and Secondary Schools Emergency Relief, or ESSER, funds. The Department of Education has disbursed US$122 billion to help schools prevent the spread of COVID-19 and operate safely.
With fewer COVID-19 precautions such as masking and testing in place for the fall of 2022, Charlotte-Mecklenburg schools are continuing to invest in air filtration and cleaning ducts to improve air circulation in school buildings.
School districts have used this money to address a variety of needs, including staffing, academic support and mental health, but much of it is still available. And only a handful of states have invested in HVAC. According to a review by the independent Brookings Institution, less than 5% of the money from the most recent round of ESSER funds had been spent through the first quarter of 2022.
Another $3 billion was authorized in the recently enacted Inflation Reduction Act for environmental and climate justice block grants. These can be used to upgrade buildings and ventilation systems to reduce indoor air pollution.
School districts may be tempted to put indoor air interventions on the back burner, given widespread perceptions that the pandemic is over and the many other challenges they face. But in our view, other educational interventions will be less effective if kids are frequently absent due to illness or unable to concentrate in the classroom.
We believe it is important for families and staff to understand the benefits that healthy indoor learning environments offer to everyone who spends time in school buildings, and to hold states and school districts accountable for investing now in HVAC improvements for healthier school buildings.
Lava fountaining above the volcanic fissure of the Holuhraun flood lava eruption in Iceland in September 2014, a small-scale analog to the eruptions in the Deccan Traps 66 million years ago and other continental flood basalts. Photo credit: Michelle Parks, University of Iceland. BERKELEY — Mass extinctions litter the history of life on Earth, with about a dozen known in addition to the five largest ones — the last of which, at the end of the Cretaceous Period 66 million years ago, killed off the dinosaurs and 70% of all life on Earth.
A new study, led by scientists at Dartmouth College in New Hampshire, concludes that most of these mass extinctions had one thing in common: They occurred after mega-eruptions that spewed volcanic lava and toxic gases for hundreds of thousands of years, and some for as long as a million years.
The analysis linking mass extinctions throughout Earth’s history with major eruptions, characterized by lava and gas spilling from perhaps dozens of volcanoes and long fissure vents, confirms what many geologists have suspected for years.
The most well-known mass extinction, referred to as the Cretaceous-Paleogene (K-Pg) extinction, was famously tied to a comet or asteroid impact in the Caribbean, but geologists have since found that the impact was preceded by a long period of eruptions in India that left behind flood basalts known today as the Deccan Traps.
Massive amounts of sulfur dioxide emitted during the long-term eruption would have cooled the planet and caused the massive die-off seen in the fossil record.
“It's been obvious to me for some time that there is this correlation between mass extinctions and flood basalt episodes,” said study co-author Paul Renne, professor-in-residence of earth and planetary science at the University of California, Berkeley, and director of the Berkeley Geochronology Center. “But nobody has approached it in the way that’s done in this work, which is to look at the actual rates at which the eruptions happened, which is presumably related to the rate at which climate modifying gases are injected into the atmosphere. And from the analysis, it looks like the rates really matter, especially for the really big ones.”
In fact, he said, there seems to be a threshold “beyond which you're going to get a mass extinction and below which you might get some minor climate perturbations, but not something that extinguishes half of all life on the planet.”
One implication of the study is that the K-Pg extinction was predestined by the Deccan Traps eruptions. The bolide impact was simply the coup de grâce.
“Our results indicate that in all likelihood there would have been a mass extinction at the Cretaceous-Paleogene boundary of some significant magnitude, regardless of whether there was an impact or not, which can be shown more quantitatively now,” Renne said. “The fact that there was an impact undoubtedly made things worse.”
The impact of repeated eruptions over millennia
The new study, publishedin the journal Proceedings of the National Academy of Sciences, shows that four of the five biggest mass extinctions over the past 540 million years — the so-called Phanerozoic Eon — and a handful of other smaller, but still planet-wide, mass extinctions correlate with major lava events that produced large igneous provinces. Known meteor impacts do not correlate with the timeline of mass extinctions.
In the study, a “large” igneous province is one containing at least 100,000 cubic kilometers of magma. For context, the 1980 eruption of Mount St. Helens in Washington involved less than 1 cubic kilometer of magma.
The researchers said that most of the volcanoes represented in the study erupted about a million times more lava than Mount St. Helens did.
The Deccan Traps, for example — traps is an Indian word for steps, because of the step-like structure of overlapping lava flows — erupted over a period of 1 million years and spewed lava flows for distances of at least 500 kilometers, in some places nearly 2 kilometers thick.
“The large, step-like areas of igneous rock from these big volcanic eruptions seem to line up in time with mass extinctions and other significant climactic and environmental events,” said the study’s lead author, Theodore Green, an undergraduate at Dartmouth College who conducted the research as part of the Senior Fellowship program. He now is a graduate student at Princeton University.
The researchers compared the best available estimates of flood basalt eruptions with periods of drastic species die-offs in the geological record. To prove that the correlation was more than chance, they examined whether the eruptions would line up just as well with a randomly generated pattern and repeated the exercise with 100 million such patterns. They determined that the chance that the correlation between eruptions and extinctions was merely random was one in 100.
“While it is difficult to determine if a particular volcanic outburst caused one particular mass extinction, our results make it hard to ignore the role of volcanism in extinction,” said Brenhin Keller, an assistant professor of earth sciences at Dartmouth and senior author of the paper. Keller was a postdoctoral fellow with Renne between 2016 and 2019.
Flood basalt eruptions aren't common in the geologic record, said Green. The last one of comparable, but significantly smaller, scale happened about 16 million years ago in the Pacific Northwest, producing what’s known as the Columbia River Basalt Province. According to Renne, the eruptions are accompanied by massive releases of carbon dioxide, which warms the atmosphere, as well as sulfur dioxide, which cools the atmosphere. Recent evidence indicates that the cooling that leads to a mass extinction is often preceded by warming because the CO2 is emitted first because of its lower solubility in magma than in sulfur.
Renne noted that improved dates for flood basalt events were key to providing better estimates of the rate of eruptions, which enabled the study.
“The punch line is that our ability to draw these kinds of quantitative conclusions have been limited by the availability of high precision geochronology data,” Renne said. “So, this is a poster child for the importance of geochronology.”
Note: Some of this text comes from a press release distributed by Dartmouth’s Office of Communications.
Robert Sanders writes for the UC Berkeley News Center.
LAKE COUNTY, Calif. — Lake County Animal Care and Control has several dogs, including puppies, waiting for new homes.
Dogs available for adoption this week include mixes of border collie, German shepherd, husky, Labrador retriever, pit bull and Rottweiler.
Dogs that are adopted from Lake County Animal Care and Control are either neutered or spayed, microchipped and, if old enough, given a rabies shot and county license before being released to their new owner. License fees do not apply to residents of the cities of Lakeport or Clearlake.
The following dogs at the Lake County Animal Care and Control shelter have been cleared for adoption.
Call Lake County Animal Care and Control at 707-263-0278 or visit the shelter online for information on visiting or adopting.
This 2-year-old male border collie is in kennel No. 18, ID No. LCAC-A-3995. Photo courtesy of Lake County Animal Care and Control. Male border collie
This 2-year-old male border collie has a black and white coat.
He is in kennel No. 18, ID No. LCAC-A-3995.
This 2-year-old female Labrador retriever mix is in kennel No. 19, ID No. LCAC-A-3994. Photo courtesy of Lake County Animal Care and Control. Labrador retriever mix
This 2-year-old female Labrador retriever mix has a short black coat.
She is in kennel No. 19, ID No. LCAC-A-3994.
This 3-year-old male husky is in kennel No. 22, ID No. LCAC-A-4014. Photo courtesy of Lake County Animal Care and Control. Male husky
This 3-year-old male husky has a short tricolor coat.
He is in kennel No. 22, ID No. LCAC-A-4014.
This 2-month-old male pit bull terrier mix puppy is in kennel No. 23c, ID No. LCAC-A-4118. Photo courtesy of Lake County Animal Care and Control. Male pit mix puppy
This 2-month-old male pit bull terrier mix puppy has a short gray and white coat.
He is in kennel No. 23c, ID No. LCAC-A-4118.
This 2-month-old female pit bull terrier mix puppy is in kennel No. 24c, ID No. LCAC-A-4122. Photo courtesy of Lake County Animal Care and Control. Female pit mix puppy
This 2-month-old female pit bull terrier mix puppy has a short white coat.
He is in kennel No. 24c, ID No. LCAC-A-4122.
This 2-year-old male German shepherd is in kennel No. 25, ID No. LCAC-A-3870. Photo courtesy of Lake County Animal Care and Control. Male German shepherd
This 2-year-old male German shepherd has a black and tan coat.
Shelter staff called him a “handsome sweet dude who is motivated by treats and does well walking on a leash.
He is in kennel No. 25, ID No. LCAC-A-3870.
This 7-month-old female German shepherd mix is in kennel No. 26, ID No. LCAC-A-4011. Photo courtesy of Lake County Animal Care and Control. German shepherd mix
This 7-month-old female German shepherd mix has a black and tan coat.
She is in kennel No. 26, ID No. LCAC-A-4011.
This 1-year-old female husky is in kennel No. 27, ID No. LCAC-A-3893. Photo courtesy of Lake County Animal Care and Control. Female husky
This 1-year-old female husky has a cream and black coat.
She is in kennel No. 27, ID No. LCAC-A-3893.
This 7-month-old male German shepherd mix pup is in kennel No. 28, ID No. LCAC-A-4012. Photo courtesy of Lake County Animal Care and Control. German shepherd mix
This 7-month-old male German shepherd mix pup has a black and tan coat.
He is in kennel No. 28, ID No. LCAC-A-4012.
This 1-year-old male German shepherd-husky mix is in kennel No. 32, ID No. LCAC-A-4079. Photo courtesy of Lake County Animal Care and Control. German shepherd-husky
This 1-year-old male German shepherd-husky mix has a short tan coat.
He is in kennel No. 32, ID No. LCAC-A-4079.
This 4-year-old female Rottweiler is in kennel No. 34, ID No. LCAC-A-4013. Photo courtesy of Lake County Animal Care and Control. Rottweiler mix
This 4-year-old female Rottweiler has a short black and tan coat.
She is in kennel No. 34, ID No. LCAC-A-4013.
Email Elizabeth Larson at This email address is being protected from spambots. You need JavaScript enabled to view it.. Follow her on Twitter, @ERLarson, or Lake County News, @LakeCoNews.

 How to resolve AdBlock issue?