Explaining why wait times can be so lengthy in the emergency room, a new study by UC San Francisco reports that emergency department capacity hasn’t kept up with patient demand in California over the last decade.
The researchers found that the number of emergency departments, or EDs, decreased by nearly 4% in California, while the number of ED visits rose by 7.4%.
It is the first analysis of emergency medicine patterns in recent years.
The researchers also reported that the number of high-severity visits rose by nearly 68%, while the number of low-severity visits declined by 63 percent.
“We know that there is overcrowding in the ED,” said lead author Renee Y. Hsia, MD, a UCSF professor of emergency medicine. “Capacity has largely failed to match the rise in patient demand.”
The paper published June 22, 2023 in JAMA Network Open.
Amid numerous changes in the U.S. health care system in recent years, emergency departments continue to play a vital role in the system. EDs are required to treat all patients regardless of ability to pay, and they function as a safety net for uninsured patients, many of whom use the ED for primary care services.
The new study used data from the California Department of Health Care Access and Information and the U.S. Census Bureau from January 1, 2011, to December 31, 2021.
In that time, California’s population grew by 4.2%, but the number of emergency departments in California fell from 339 to 326, while the number of hospital beds decreased by 2.5% (75,940 to 74,052).
“Our findings show what many health care workers already know to be true: the burden on emergency departments across the state of California has intensified over the last 10 to15 years,” Hsia said.
“Becoming aware of these trends is the first step to improving emergency department care,” she said. “To efficiently and equitably address ED crowding and improve overall care, policymakers and health care administrators should work to increase ED capacity, while also making thoughtful decisions about where and how to best allocate resources.”
Co-authors: From UCSF: Renee Y. Hsia, MD, MSc; Stefany Zagorov; Michael T. Savides; Madeline Feldmeier; and Newton Addo. From the National Bureau of Economic Research: Nandita Sarkar, PhD.
Over the past two decades, a staggering 21.8 million Americans found themselves living within 3 miles (5 kilometers) of a large wildfire. Most of those residents would have had to evacuate, and many would have been exposed to smoke and emotional trauma from the fire.
Nearly 600,000 of them were directly exposed to the fire, with their homes inside the wildfire perimeter.
Those statistics reflect how the number of people directly exposed to wildfires more than doubled from 2000 to 2019, my team’s new research shows.
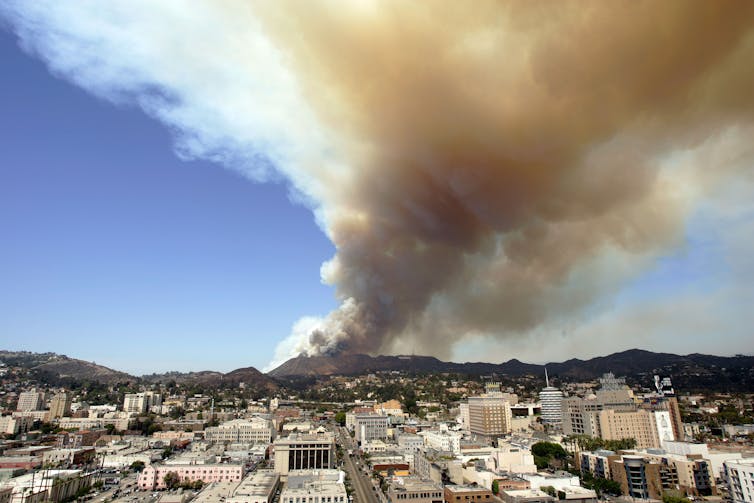
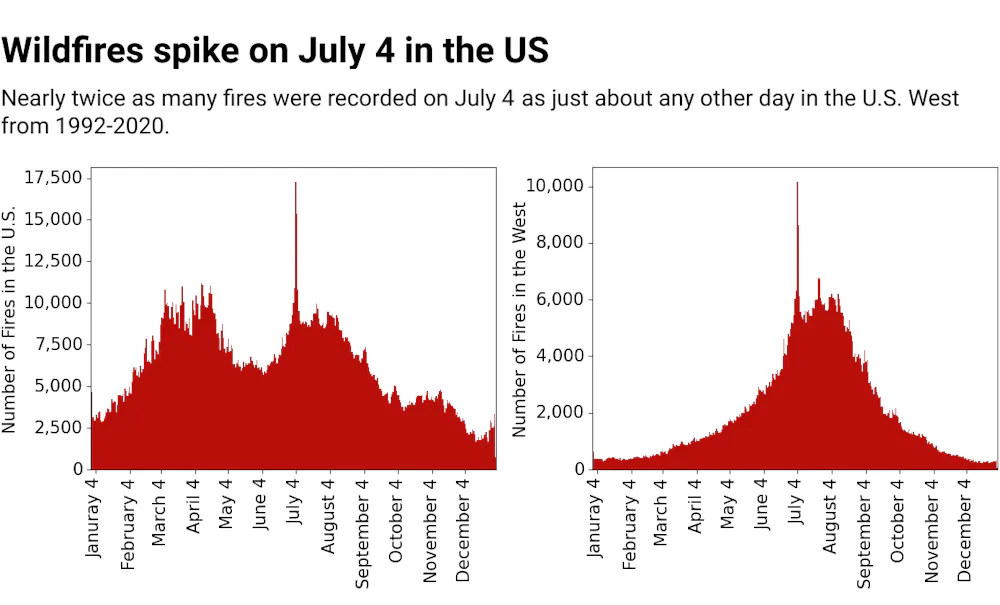
That knowledge has implications for how communities prepare to fight wildfires in the future, how they respond to population growth and whether policy changes such as increasing insurance premiums to reduce losses will be effective. It’s also a reminder of what’s at risk from human activities, such as fireworks on July 4, a day when wildfire ignitions spike.
I am a climate scientist who studies the wildfire-climate relationship and its socioenvironmental impacts. For the new study, colleagues and I analyzed the annual boundaries of more than 15,000 large wildfires across the Lower 48 states and annual population distribution data to estimate the number of people exposed to those fires.
Not every home within a wildfire boundary burns. If you picture wildfire photos taken from a plane, fires generally burn in patches rather than as a wall of flame, and pockets of homes survive.
We found that 80% of the human exposure to wildfires – involving people living within a wildfire boundary from 2000 to 2019 – was in Western states.
California stood out in our analysis. More than 70% of Americans directly exposed to wildfires were in California, but only 15% of the area burned was there.
What climate change has to do with wildfires
Hot, dry weather pulls moisture from plants and soil, leaving dry fuel that can easily burn. On a windy day – such as California often sees during its hottest, driest months – a spark, for example from a power line, campfire or lightning, can start a wildfire that quickly spreads.
Recent research published in June 2023 shows that almost all of the increase in California’s burned area in recent decades has been due to anthropogenic climate change – meaning climate change caused by humans.
Our new research looked beyond just the area burned and asked: Where were people exposed to wildfires, and why?
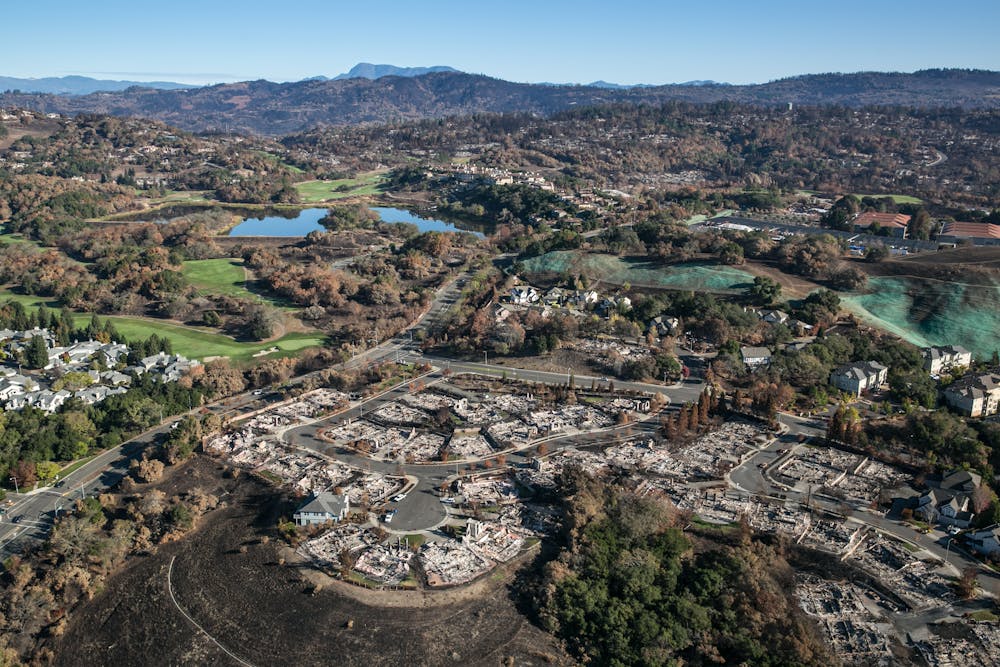
New homes on the edges of cities have been caught in some fires, like the one in Santa Rosa in 2017. But most of the people exposed were in neighborhoods existing well before 2000.George Rose/Getty Images
We found that while the population has grown in the wildland-urban interface, where houses intermingle with forests, shrublands or grasslands, that accounted for only about one-quarter of the increase in the number of humans directly exposed to wildfires across the Lower 48 states from 2000 to 2019.
Three-quarters of that 125% increase in exposure was due to fires’ increasingly encroaching on existing communities. The total burned area increased only 38%, but the locations of intense fires near towns and cities put lives at risk.
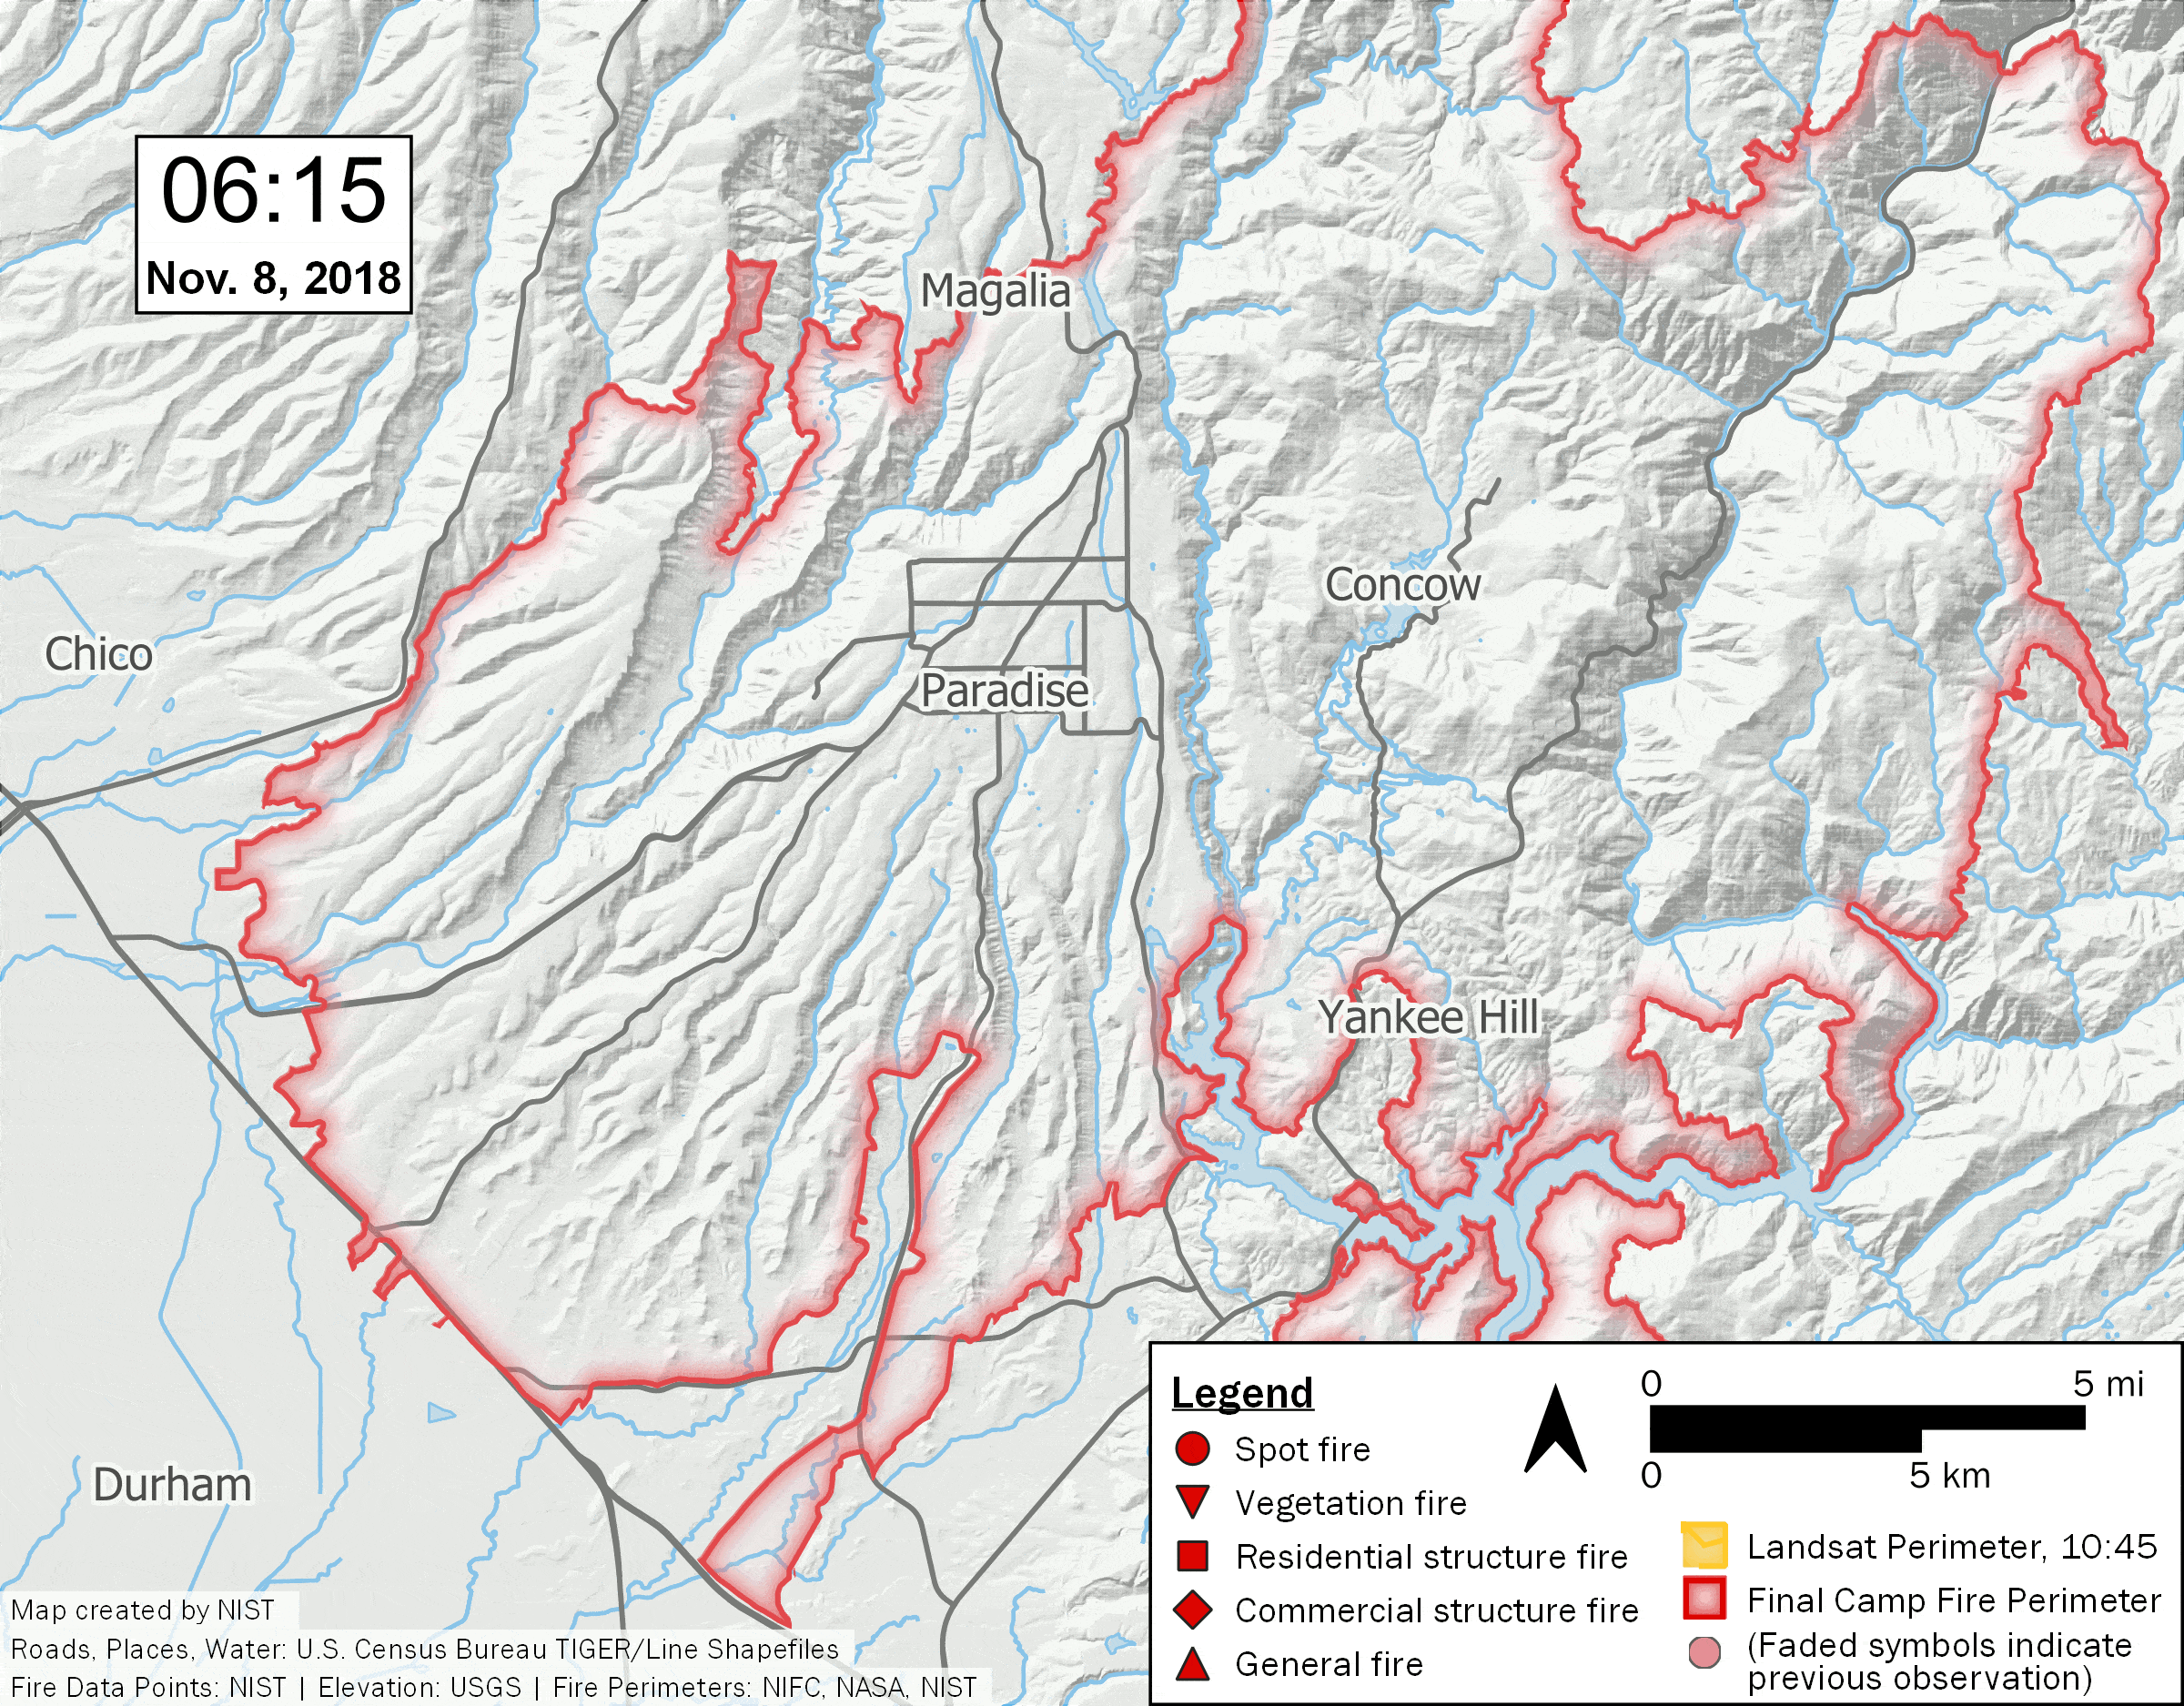
The 2018 fire that destroyed Paradise, Calif., began as a small vegetation fire that ignited new fires as the wind blew its embers. NIST
Wildfires in the high mountains in recent decades provide another way to look at the role that rising temperatures play in increasing fire activity.
High mountain forests have few cars, homes and power lines that could spark fires, and humans have historically done little to clear brush there or fight fires that could interfere with natural fire regimes. These regions were long considered too wet and cool to regularly burn. Yet my team’s past research showed fires have been burning there at unprecedented rates in recent years, mainly because of warming and drying trends in the Western U.S.
What can communities do to lower the risk?
Wildfire risk isn’t slowing. Studies have shown that even in conservative scenarios, the amount of area that burns in Western wildfires is projected to grow in the next few decades.
How much these fires grow and how intense they become depends largely on warming trends. Reducing emissions will help slow warming, but the risk is already high. Communities will have to both adapt to more wildfires and take steps to mitigate their impacts.
Developing community-level wildfire response plans, reducing human ignitions of wildfires and improving zoning and building codes can help prevent fires from becoming destructive. Building wildfire shelters in remote communities and ensuring resources are available to the most vulnerable people are also necessary to lessen the adverse societal impacts of wildfires.
LAKE COUNTY, Calif. — Millions of dollars are heading to Lake County for road repairs thanks to the latest action by the California Transportation Commission.
The California Transportation Commission, or CTC, last week invested nearly $2 billion into improving the state’s transportation infrastructure while approving an additional $2.3 billion for future projects.
The nearly $2 billion allocation reflects more than $571 million in funding from the 2021 federal Infrastructure Investment and Jobs Act, or IIJA, and more than $257 million in funding from Senate Bill (SB) 1, the Road Repair and Accountability Act of 2017.
The $2.3 billion comprises $1.75 billion representing the third funding cycle of programs established by SB 1 and $540 million in active transportation projects sponsored by local metropolitan planning organizations, charting the course for future allocations.
“SB 1 and IIJA funding are helping rebuild and transform California’s transportation future, and we are putting that investment to work to create a system that allows all of us to travel in an equitable, safe and sustainable way,” said Caltrans Director Tony Tavares.
Lake County projects selected for funding include $2.4 million in support allocations toward roadway and guardrail upgrades, the construction of left-turn lanes, installation of lighting, pedestrian activated flashing beacons and sidewalk and curb ramps on Route 29 near Middletown from south of Central Park Road to north of Young Street in Lake County.
Another $2.7 million has been awarded for emergency allocations toward embankment repairs and drainage improvements on Route 175 near Lakeport in Lake County.
In addition, $1.9 million was approved for emergency allocations for embankment, roadway and guardrail repairs on Route 175 west of Arroyo Vista Road to west of Socrates Mine Road near Whispering Pines in Lake County.
Finally, $11.2 million will go toward emergency allocations for roadway and drainage repairs along with the removal of hazardous trees at various locations on U.S. 101 and Routes 1, 20, 29, 53, 128 and 175 in Humboldt, Mendocino and Lake counties.
Other projects that the CTC approved in its nearly $2 billion worth of investments include:
• $5.5 million in federal IIJA funding toward guardrail and roadway improvements along Route 1 from north of Route 128 to south of Navarro Ridge Road near Albion in Mendocino County.
• $3.2 million including more than $2.9 million in federal IIJA funding and $98,000 in SB1 funding toward roadway and drainage upgrades on Route 1 at Navarro Ridge Road near Albion in Mendocino County.
• $3 million in support allocations toward roadway and guardrail improvements and bridge replacement on Route 36 near Carlotta from west of Fisher Road to west of Wilder Road in Humboldt County.
• Approximately $1 million in SB1 funding in support allocations toward drainage and fish-passage improvements on U.S. 101 near Cooks Valley in Humboldt County.
• $2 million in SB1 funding in support allocations toward drainage and lighting upgrades at various locations along U.S.101 from the Eel River Bridge to north of the Mendocino County line near Cooks Valley in Humboldt County.
• $1.4 million including more than $1.2 million in federal IIJA funding in support allocations toward mitigation work for freshwater wetland expansion and tidal restoration of salt marsh habitat at various locations on U.S. 101 from 11th Street in Arcata to the Eureka Slough Bridge in Humboldt County.
• $947,000 including more than $838,000 in federal IIJA funding in support allocations toward mitigation work for freshwater wetland expansion and tidal restoration of salt marsh habitat at various locations on U.S. 101 from south of Jacobs Avenue in Eureka to north of the Bayside Cutoff in Humboldt County.
• $612,000 including more than $541,000 in federal IIJA funding and $40,000 in SB 1 funding in support allocations toward mitigation work for freshwater wetland expansion and tidal restoration of salt marsh habitat at various locations on U.S. 101 between Arcata and Eureka from south of the Jacoby Creek Bridge to north of the Gannon Slough Bridge in Humboldt County.
• $7.1 million of emergency allocations toward drainage and roadway repairs as well as the removal of hazardous trees at various locations on U.S. 101 and U.S. 199 and Route 169 and Route 197 in Humboldt and Del Norte Counties.
• $6.5 million of emergency allocations toward drainage, embankment and roadway repairs on Route 254 near Miranda from north of Redwood Lane to Cathey Road in Humboldt County.
The $1.75 billion for future investments cover three SB 1 competitive grant programs: $1.08 billion for the Trade Corridor Enhancement Program, or TCEP; $532.8 million for the Solutions for Congested Corridors Program, or SCCP; and $142.5 million for the Local Partnership Program, or LPP.
The programs included, for the first time, input from the new Interagency Equity Advisory Committee in the evaluation of projects. This funding round also marks the first cycle to incorporate all principles of the state’s Climate Action Plan for Transportation Infrastructure.
The TCEP funding will go to 26 projects that support infrastructure improvements on corridors that carry a high volume of freight traffic with the goal of increasing efficiency, improving safety, and constructing an equitable and sustainable freight system.
More than a third (10 of 26) of the TCEP projects include zero-emission technology components to support the deployment of a zero-emission freight transportation system and invest in light, medium and heavy zero-emission vehicle infrastructure.
The SCCP funding will go to 10 projects to achieve a balanced set of transportation, environmental, and community access improvements to reduce congestion throughout the state. All 10 SCCP projects are multimodal, and five include active transportation improvements.
The LPP funding will go to 11 projects that support counties, cities, districts, and regional transportation agencies where voters have approved fees or taxes dedicated solely to transportation.
Local LPP projects include approximately $6 million to fund the city of Ukiah Urban Core Rehabilitation and Transportation Project in Mendocino County.
The CTC also adopted the 2023 MPO Active Transportation Program, totaling $540 million for future investments. The 134 projects approved for funding include a broad range of active transportation infrastructure improvements, including more than 120 miles of new bikeways, 60 miles of new sidewalks, and many other improvements to intersections, crosswalks, shade and signage.
More than 90% of the funding, $494 million, will fund projects benefiting disadvantaged communities, and $290 million (54%) will fund Safe Routes to School projects.
MPO active transportation projects include $2.3 million to fund the city of Eureka C Street Bike Boulevard in Humboldt County and $9 million toward the city of Eureka Bay to Zoo Trail in Humboldt County.
The IIJA, also known as the “Bipartisan Infrastructure Law,” is a once-in-a-generation investment in our nation's infrastructure to improve the sustainability and resiliency of our energy, water, broadband and transportation systems.
Since November 2021, California has received more than $20 billion in federal infrastructure funding.
That includes more than $15.1 billion in federal transportation funding to upgrade the state’s roads, bridges, rail, public transit, airports, electric vehicle charging network, ports, and waterways.
These transportation investments alone have already created nearly 48,000 jobs.
The influx of federal funding is on top of California’s multiyear infrastructure investments in transit and intercity rail projects, safe walking and biking options, and upgrades to the state’s economy-powering supply chain, in addition to SB 1, which provides $5 billion in transportation funding annually that is shared equally between state and local agencies.
Road projects progress through construction phases more quickly based on the availability of SB 1 funds, including projects that are partially funded by SB 1.
To review the latest news and information on state and federal infrastructure investments, visit RebuildingCA.ca.gov, which contains data on the increased funding. Website visitors can learn more about the different state and federal infrastructure programs, track the amount of funding California is receiving, and find projects on an updated interactive map.
The California Department of Alcoholic Beverage Control, or ABC, encourages the public to celebrate July 4 responsibly by designating a sober driver for celebrations involving alcohol.
Licensees can help keep the public safe by checking IDs and not serving obviously intoxicated patrons.
“If you choose to celebrate with alcohol, make sure to designate a sober driver or arrange a ride with an app or taxi service,” said ABC Director Eric Hirata. “We can all do our part to keep communities safe by preventing drinking and driving.”
ABC suggests licensees offer nonalcoholic drinks for designated sober drivers and monitor who is drinking alcohol.
If you see people leaving who have been drinking alcohol, check on how they are getting home and offer alternate transportation if needed.
The California Highway Patrol has deployed extra patrol officers over the holiday weekend as part of a maximum enforcement period, or MEP, that began at 6:01 p.m. on Friday, June 30, and continues through 11:59 p.m. on Tuesday, July 4.
There were 44 people killed in crashes on California’s roadways during the 2022 Independence Day MEP, and CHP made 998 arrests for driving under the influence of alcohol or drugs.
In addition to speeding violations, officers will be on the lookout for distracted drivers and motorists suspected of driving under the influence of drugs or alcohol.
The average cost of a first-time DUI arrest is approximately $13,500, accounting for vehicle impound fees, fines, attorney fees, auto insurance hikes and other penalties.
California Attorney General Rob Bonta announced the release of the annual Homicide in California, Crime in California, Use of Force Incident Reporting, Juvenile Justice in California, and Crime Guns in California statistical reports.
The information contained in the reports reflects statistics for 2022 as submitted by California law enforcement agencies and other criminal justice entities.
The reports provide policymakers, researchers, law enforcement, and members of the public with vital statewide information on criminal justice statistics in California to support informed policy choices based on data and analysis and help protect the safety and well-being of all Californians.
This year, in accordance with Assembly Bill 1191 (D-McCarty), the California Department of Justice, or DOJ, has released the first annual Crime Gun in California Report, which provides insights on patterns and trends relating to recovered firearms that have been illegally possessed, used in a crime, or suspected to have been used in a crime.
“Having access to good data is a cornerstone of responsible public policy. The data released today is essential for understanding, preventing, and combating crime,” said Bonta. “In 2022, California made significant progress towards reducing its homicide rates, but more remains to be done. While crime rates remain significantly below their historical highs, property and violent crimes continue to have devastating consequences for communities across the state, and gun violence remains a major threat to public safety.”
Bonta continued, “Despite having a gun death rate significantly below the national average, gun violence accounted for nearly three-fourths of all homicides in California in 2022. That is unacceptable. My office is committed to confronting these crimes head-on by holding law-breakers accountable, providing victims the resources they need to heal, and working proactively to prevent crime from happening in the first place.”
Each year, DOJ publishes annual reports on various criminal justice statistics in California. While law enforcement agencies across the state are in the process of transitioning to the new data collection system known as the California Incident-Based Reporting System, or CIBRS, the format of the information made available in this year’s reports remains consistent with previous years.
The ongoing transition to incident-based reporting will ultimately enable law enforcement agencies to collect more in-depth information about specific incidents than previously available in the legacy system that had been in use for decades.
For instance, under the legacy system, statistical data was typically collected using the “Hierarchy Rule,” i.e., only the most serious offense within a criminal incident is counted for statistical purposes. As a result, if a robbery and a homicide occurred in the same incident, the legacy system only counts the homicide for statistical reporting purposes.
Through CIBRS, policymakers, law enforcement, and members of the public will eventually have more detailed information, context, and specificity about crime in the state. Law enforcement agencies across California are currently in the process of transitioning to CIBRS.
To date, more than 600 reporting agencies have completed the transition and are in the process of becoming certified by DOJ. DOJ continues to work with agencies across the state during this ongoing transition.
In the interim, in order to help ensure the annual criminal justice reports remain complete and accurate to the fullest extent possible, DOJ continues to accept data in both the legacy and CIBRS formats.
The information made available in this year’s reports is a combination of data collected under both reporting methods.
Attorney General Bonta encourages researchers, academics, and all members of the public to analyze the data and use it to help inform public discourse on the state’s criminal justice system.
Key findings from each of the four reports released by Bonta and a brief description of their contents are available below:
Homicide in California 2022 provides information about the crime of homicide, including demographic data of victims, persons arrested for homicide, persons sentenced to death, peace officers feloniously killed in the line of duty, and justifiable homicides. Some of the key findings include:
• The homicide rate, defined as the number of homicides per 100,000 people in the state, decreased 5 percent in 2022 (from 6 per 100,000 in 2021 to 5.7 per 100,000 in 2022), remaining significantly below California’s historical high of 12.9 per 100,000 in 1993. The number of homicides in 2022 remains roughly half of the number of homicides in 1993, despite the population swelling from approximately 31 million in 1993 to more than 39 million in 2022. • Firearms continue to be the most common weapon used in homicides. In 2022, 73.6% of homicides, where the weapon was identified, involved a firearm. • Among California’s 36 counties with populations of 100,000 or more, Merced County experienced the highest reported homicide rate (12.3 per 100,000) and Santa Cruz County, the lowest (0.8 per 100,000). • Among homicides where the victim’s relationship to the suspect was identified, females (37.1%) were more likely than males (7.7%) to be killed by their spouse, parent, or child. • There was a 4.2% decrease in total homicide arrests from 1,550 in 2021 to 1,485 in 2022. Crime in California 2022 presents statewide statistics for reported crimes, arrests, dispositions of adult felony arrests, adult probation, criminal justice personnel, civilians’ complaints against peace officers, domestic violence-related calls for assistance, anti-reproductive-rights crimes, and law enforcement officers killed or assaulted. Some of the key findings include:
• The violent crime rate — i.e., the number of violent crimes per 100,000 people — increased 6.1% from 466.2 in 2021 to 494.6 in 2022, remaining significantly below California’s historical high of 1,103.9 in 1992. • The property crime rate increased 6.2% from 2,178.4 in 2021 to 2,313.6 in 2022, remaining significantly below California’s historical high of 6,880.6 in 1980. • The total arrest rate decreased 2.7% from 2,606.3 in 2021 to 2,535.2 in 2022, continuing an ongoing year-to-year downward trend that began in 2004 when the total arrest rate was 5,385.5. In 2022, the total number of adults on active probation reached its lowest level since 1980 at 151,402. • The total number of full-time criminal justice personnel — including law enforcement, prosecutors, investigators, public defenders, and probation officers — decreased 1.4%. From 2021 to 2022, the number of law enforcement, prosecution and probation personnel decreased 1.3, 0.3 and 3.6 percent, respectively.
Use of Force Incident Reporting 2021 presents a summary overview of use of force and discharge-of-firearm incidents involving a peace officer, as defined in California Government Code section 12525.2. Some of the key findings include:
• In 2022, there were 597 incidents that involved the use of force resulting in serious bodily injury or death of a civilian or officer, or the discharge of a firearm. Of those incidents: 49.4% occurred during a call for service. 16.1% occurred while either a crime was in progress or while officers were investigating suspicious persons or circumstances. 74.9% resulted from a vehicle, bike, or pedestrian stop. In 2022, 612 civilians were involved in incidents that involved the discharge of a firearm or use of force resulting in serious bodily injury or death. Of those civilians: 48.4% were Hispanic. 25.3% were white. 19.3% were black. • In 2022, 1,375 officers were involved in incidents that involved the discharge of a firearm or use of force resulting in serious bodily injury or death. Of those officers: 82.5% were not injured. 17.1% were injured. 0.3% died.
Juvenile Justice in California 2022 provides insight into the juvenile justice process by reporting the number of arrests, referrals to probation departments, petitions filed, and dispositions for juveniles tried in juvenile and adult courts. Some of the key findings include:
• Of the 36,640 referrals of juveniles to probation, 94.5% were referred by law enforcement. Of the 26,000 juvenile arrests: 45.8% were for a felony offense. 49.8% were for a misdemeanor offense. 4.4% were for a status offense, defined as acts that would not be classified as crimes if committed by adults. • Of those same juveniles: 62.5% were referred to probation. 20.6% were counseled and released. 16.9% were turned over to another agency. Of the 17,627 juvenile cases that were formally handled by a juvenile court, 51.3% resulted in juveniles being made wards of the court. • Of the 59 juvenile cases tried in adult court, 71.2% resulted in a conviction.
Crime Guns in California 2022 provides insight into patterns and trends relating to recovered firearms that have been illegally possessed, used in a crime, or suspected to have been used in a crime — also known as “crime guns”— including the leading sources and origins of those firearms. Some of the other key findings include:
• Approximately 545,946 unique crime guns with identifiable serial numbers were recovered by law enforcement agencies in California and entered in the Automated Firearm System (AFS) between January 1, 2010 and December 31, 2022. Additionally, approximately 85,402 crime guns were entered in AFS without any recorded serial number over this period. • 76,135 (13.94%) of the serialized crime guns entered in AFS over this period could be associated with a total of 1,929 distinct California firearm dealers. • While all the identified dealers sold or transferred at least one firearm that was later recovered as a crime gun, 344 dealers were associated with only one crime gun and 82 dealers were associated with roughly half of all crime guns (38,230 firearms). The highest number of crime guns associated with one dealer was 1,652. • On average, each licensed dealer sold or transferred 39 firearms that were later identified as a crime gun. • The manufacturers associated with the most crime gun records included: Smith & Wesson; Glock; Sturm, Ruger, & Co.; Taurus Forjas; and Remington. • Crime guns were recovered by law enforcement in all 58 counties. • Counties with higher populations tended to have higher numbers of crime guns. However, when accounting for crime guns per capita, a county’s population size did not appear to have any reliable correlation with its number of crime guns per person. In other words, more populous areas, like cities, were not necessarily more likely to recover more or fewer crime guns per capita than less populous area. • Over the past decade, California experienced a significant increase in the number of crime guns recovered without serial numbers. In 2022, there was a 7% drop in the number of crime guns without serial numbers reported statewide, the first decrease recorded since 2013.
The Homicide in California report is available here. The Crime in California report is available here. The Use of Force Incident Reporting report is available here. The Juvenile Justice in California report is available here. The Crime Guns in California Report is available here. The underlying data associated with the annual reports is available on OpenJustice here.
While some states, like Vermont, eliminated the property voting requirement in the 18th century, this shift became more popular in the 1820s and the 1830s.
Congress passed the 15th Amendment in 1870, giving Black men and others the right to vote, regardless of race.
State lawmakers also used bureaucratic measures, such as a poll tax, renewed attempts at a property requirement and literacy tests, to prevent African Americans from voting.
The fight over African American suffrage continued for decades, and many courageous Americans protested and were arrested or killed in the struggle to exercise their voting rights.
In the 1960s, Congress passed additional legal measures to protect the voting rights of Black Americans. This included the 24th Amendment, which outlawed the use of poll taxes, and the 1965 Voting Rights Act, which prohibited any racial discrimination in voting.
Women’s turn
In 1920, women gained the right to vote with the addition of the 19th Amendment, following another decadeslong struggle.
Having self-governed for centuries, Native Americans were not legally recognized with voting rights until Congress approved the Indian Citizenship Act in 1924.
While that supposedly gave Native Americans the same rights as other Americans, Native Americans faced the same tactics, like violence, that white racists used to prevent Black Americans from voting.
But equality for women, young people and racially marginalized groups did not change overnight.
Social equality remains far off for many people, including undocumented immigrants, for example, and LGBTQ+ individuals.
While some states have it made it harder to vote in recent years, others have made it easier.Stephen Maturen/Getty Images
Current limitations to ‘We the People’
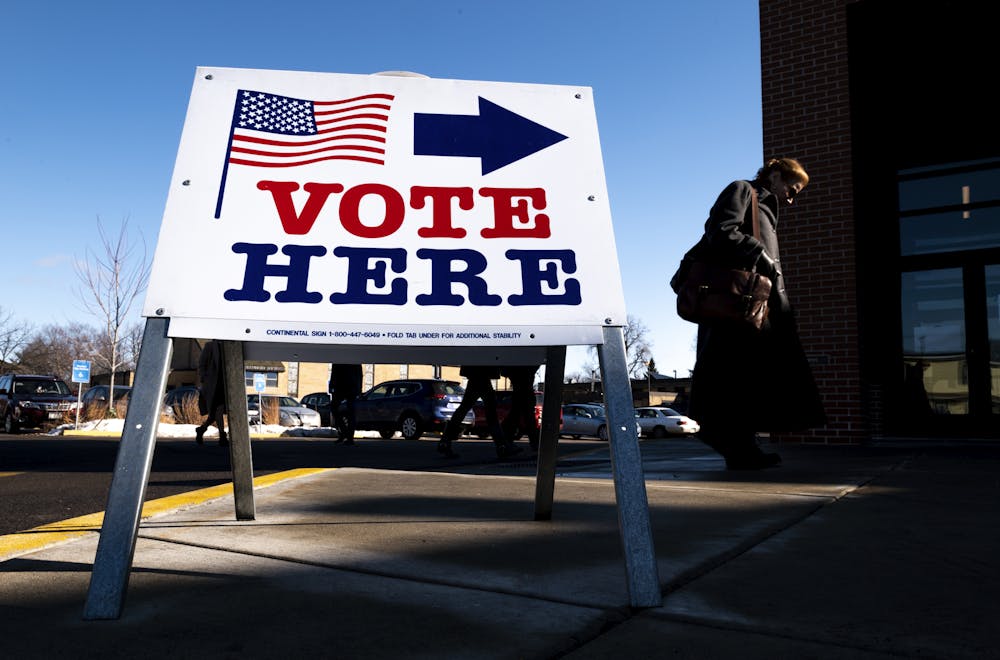
The government has recognized that citizens over the age of 18 have a right to participate in self-government. But there are still political and legal attempts to restrict people’s ability to vote.
While some states have passed new laws that make it harder to vote in recent years, other states have made it easier.
North Carolina passed new ID requirements in April 2023 that make it difficult for those without current state identification to vote.
Twenty-five states, meanwhile, including Hawaii and Delaware, have passed laws over the last few years that make it easier to vote. One of these measures automatically registers people to vote when they turn 18.
There are more examples. The bottom line is, voters have fewer protections when it becomes harder to vote, and American democracy is not as democratic as it could be.
The big picture
Voting is not the only form of recognition and participation in a democracy. People can be respected at work, paid what they are worth and treated with dignity. Community members can be treated fairly by police, school officials and other authorities, given an equal opportunity for justice and education to improve their lives.
People can also contribute to the social and economic well-being of a democracy in ways other than voting, doing everything from planting a tree in a public park to attending a political rally.
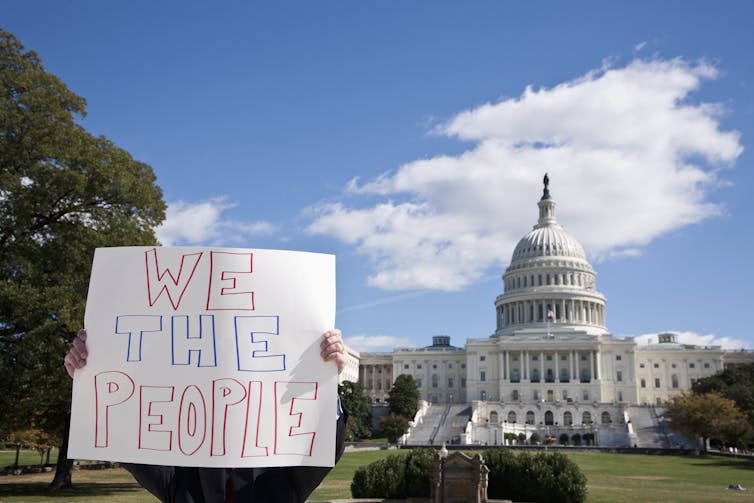
But the overall expansion of voting rights and a historical understanding of “We the People” shows that everyone belongs in a democratic society, regardless of wealth, achievement or other differences.
Sugar alternatives go by many names including artificial sweeteners, low-calorie sweeteners and nonsugar sweeteners. Marie LaFauci/Moment via Getty Images
Do low-calorie sweeteners help with weight management? And are they safe for long-term use?
This is among the most controversial topics in nutritional science. In early May 2023, the World Health Organization issued a statement that cautions against the use of nonsugar sweeteners for weight loss except for people who have preexisting diabetes.
Based on its interpretation of that large-scale review, the WHO recommended against using artificial sweeteners for weight control and concluded that there may be health risks associated with habitual consumption of nonsugar sweeteners over the long term. However, the WHO also acknowledged that the existing evidence is not conclusive and that more research needs to be done.
As neuroscientists, we study how dietary factors such as sweeteners affect the brain’s ability to perform critical functions, including metabolism, appetite, and learning and memory.
We found the WHO’s advisory surprising based on the study’s equivocal results. Determining the answers to these questions is immensely challenging, and public health messaging around recommendations can send mixed messages.
‘Healthy’ versus ‘unhealthy’ sugars
Natural sugars like glucose and fructose, together with fiber and other nutrients, are found in many food sources that are considered healthy, such as fruit. However, these simple carbohydrates have been increasingly added into manufactured food products, especially beverages. Sugar-sweetened beverages are usually high in calories and offer little else in the way of nutrition.
In the early 20th century, food and beverage manufacturers began incorporating naturally and chemically derived substances that satisfy sweet cravings but contain significantly fewer calories than natural sugars – and, in some cases, zero calories. Sugar substitutes became particularly widespread in the 1950s with the increasing popularity of diet sodas. Since then, consumers have increasingly turned to these sugar substitutes in their everyday lives.
Sugar substitutes go by many names, including high-intensity sweeteners, artificial sweeteners, nonnutritive sweeteners, low-calorie sweeteners and, as termed in the WHO report, nonsugar sweeteners.“ These include synthetic compounds like sucralose, acesulfame potassium and aspartame, and naturally derived ones, such as those from the plant Stevia rebaudiana, among many others.
Each nonsugar sweetener has a unique chemical structure, but they all activate sweet taste receptors at very low concentrations. This means that you need to add only a tiny amount of them to sweeten your coffee or tea, as opposed to heaping spoonfuls of natural sugar.
Nonsugar sweeteners are found in many soft drinks, sports drinks and energy bars.
Sugar substitutes and the quest for weight loss
Obesity and its associated metabolic conditions, like diabetes and cardiovascular disease, are now among the leading causes of preventable death in the U.S. The obesity epidemic has been linked in part to an increase in added sugar consumption over the past century.
Sugar substitutes were designed to help. The math seems straightforward: Replacing your favorite 12-ounce sugar-sweetened beverage that contains 150 calories with an artificially sweetened beverage of the same volume that contains zero calories should allow you to reduce the number of calories you take in each day and reduce your body weight over time.
However, there are conflicting studies from animal modelsand humans that have not found significant body weight gain associated with nonsugar sweeteners consumption.
Parsing the health impacts
Regardless of any potential benefits nonsugar sweeteners may have for weight control, their use must also be considered in the context of overall health.
Agencies like the WHO and the U.S. Food and Drug Administration periodically review available evidence and assess the safety of various food additives, including nonsugar sweeteners, for use in foods and beverages within what is called an acceptable daily intake limit. In this context, the acceptable daily intake is based on the estimated amount of a specific nonsugar sweetener that can be safely consumed daily over one’s entire life without adverse effects on health.
Each agency sets its own daily allowance based on the best available data. But because these experiments cannot account for all possible conditions in which these substances are used in real life, it is critical that scientists continue to investigate the health effects of food additives.
The authors of the WHO report relied on three main types of published research studies to determine whether nonsugar sweetener consumption was linked to adverse health effects. The gold standard for assessing causation is what are called randomized controlled trials.
In these studies, people are randomly assigned to either an experimental group – which receives the experimental substance, such as a nonsugar sweetener – or a control group – which receives a placebo or different substance. Participants in both groups are then tracked for a period of time, typically weeks or months. The majority of studies involving randomized controlled trials on nonsugar sweeteners to date involve this type of comparison, with nonsugar sweeteners replacing consumption of natural sugar-sweetened beverages.
The analysis of almost 50 randomized controlled trials on which the WHO based its recommendation found modest benefits of using nonsugar sweeteners for weight loss and determined that the habitual use of those nonsugar sweeteners did not lead to diabetes symptoms or indicators of cardiovascular disease. But it did find that the use of nonsugar sweeteners was associated with a higher ratio of total cholesterol to HDL, short for high-density lipoprotein, which is considered the "good cholesterol.”
That means that habitual consumers of artificial sweetener had more of the low-density lipoprotein, or LDL version, in their system. That form of “bad cholesterol” is a risk factor for heart disease.
However, other potential adverse consequences of consuming nonsugar sweeteners may take more time to appear than can be identified in the limited time frame of a randomized controlled trial.
The authors also evaluated what are called prospective cohort studies. Those studies track participants’ self-reported use of sweeteners alongside health outcomes, oftentimes over many years. They also took into account case-control studies, which identify people with or without a certain health issue, such as cancer, and then use available health records and interviews to determine the extent of nonsugar sweetener use in their past.
Examination of the cohort and case-control studies found that regular consumption of nonsugar sweetener was associated with increased fat accumulation, higher body mass index and increased incidence of Type 2 diabetes. Those findings differ from the outcomes of the randomized control studies.
Analysis of the cohort and case-control studies also concluded that a history of regular nonsugar sweetener use was linked to increased frequency of stroke, hypertension, other adverse cardiovascular events and, in pregnant people, an increased risk for premature birth. The frequency of cancer in nonsugar sweetener consumers was very low in general, though saccharin, an FDA-approved sweetener found in many food products, was associated with a bladder cancer.
The history of artificial sweeteners.
Caveats and takeaways
On the face of it, these results are alarming, but they need to be taken with a grain of salt. As the WHO report points out, these studies have significant limitations that need to be considered.
Take, for example, in the cohort and case-control studies, that higher body mass index, or BMI, was associated with greater nonsugar sweetener intake and poorer health outcomes. One possibility is that people with obesity used nonsugar sweeteners to help cut calories more than others without obesity. This makes it difficult to determine whether the disease is caused by sustained artificial sweetener use or by the other underlying conditions associated with obesity.
Additionally, the way nonsugar sweeteners are consumed is not controlled in these types of studies. So negative health outcomes could be associated with other affiliated harmful behaviors, such as more sugar or fat in the diet.
The picture is very mixed on both the benefits of nonsugar sweeteners for weight loss and their ties to adverse health issues. The WHO’s recommendation seems to have weighed the cohort and case-control studies over the randomized controlled ones, a decision that we found puzzling in light of the limitations of these studies for assessing whether nonsugar sweeteners have a causal role in disease.
As with all health-related choices, the science is complex. In our view, grabbing a diet drink to offset the calories in a slice of chocolate cake every once in a while will likely not be harmful for your health or lead to a significant weight change.
LAKE COUNTY, Calif. — The Clearlake City Council on Thursday will consider a financial report, equipment lease and an update to management staffs’ employment contract.
The council will meet at 6 p.m. Thursday, July 6, for a budget workshop before the regular meeting begins at 6 p.m. in the council chambers at Clearlake City Hall, 14050 Olympic Drive.
Comments and questions can be submitted in writing for City Council consideration by sending them to City Clerk Melissa Swanson at This email address is being protected from spambots. You need JavaScript enabled to view it..
To give the council adequate time to review your questions and comments, please submit your written comments before 4 p.m. Thursday, July 6.
Under business items, staff will present the annual financial report and single audit report for fiscal year 2021-22.
The council also will consider approving the lease with Peterson/CAT in the amount of $208,814.37.
In other business, the council will consider updates to the management classification and benefits plan and city salary. Those proposed updates include a 3% cost of living increase.
On the meeting's consent agenda — items that are considered routine in nature and usually adopted on a single vote — are warrants; consideration of rejection of proposals for design services of the dam road roundabout; approval of contract amendment with Lucy & Co. for public relations and communication; approval of contribution to Hands Up Lake County for support of the 1 Team 1 Dream Program in the amount of $30,000; approval of additional leave of absence without pay for Maintenance Worker II Johnny Miskill for June 8, 2023 through June 18, 2023; consideration of bid award for the City Hall Remodel Project to Adams Commercial General Contracting Inc. in the amount of $1,281,110 and authorize the city manager to approve change orders up to 10% of the contract price; authorization of purchase of office furniture from National Business Furniture through the GSA Program in an amount not to exceed $70,000; and authorization of a side letter with the Clearlake Police Officer Association and the Clearlake Middle Management Association.
Email Elizabeth Larson at This email address is being protected from spambots. You need JavaScript enabled to view it.. Follow her on Twitter, @ERLarson, or Lake County News, @LakeCoNews.
CHP Commissioner Sean Duryee swears in 101 CHP officers during a graduation ceremony at the CHP Academy in West Sacramento on Friday, June 30, 2023. Photo courtesy of the CHP. There are 101 new CHP officers, with some of those graduates heading to the North Coast.
On Friday, the newest members of the California Highway Patrol were sworn in during a graduation ceremony at the CHP Academy in West Sacramento.
The 101 officers are part of the CHP’s multiyear recruiting campaign to fill 1,000 vacant officer positions by hiring qualified individuals from California’s diverse communities.
The agency reported that one of the graduates is being assigned to the Clear Lake Area office in Kelseyville, with one each to go to the Crescent City and Humboldt offices.
“I want to commend these men and women, not just for the hard work they put in the past several months while training at the Academy, but for their willingness to serve the public,” said CHP Commissioner Sean Duryee. “These new officers are valued members of the CHP who are committed to improving safety in California for many years to come.”
“This diverse group of officers represents the best of California,” said Gov. Gavin Newsom. “I’m profoundly grateful they have chosen to answer the call to serve — and committed themselves to improving public safety and building trust across the Golden State.”
With the addition of these new officers, CHP — the largest state police agency in the United States — now has over 6,550 sworn officers assigned across California.
Next month, a new class of 128 cadets is expected to join the two existing cadet classes at the CHP Academy, bringing the total number of CHP cadets in training to 366.
This will mark the highest number of cadets in training in over 14 years.
CHP Cadet Training Class I-23 is one of six cadet classes scheduled to attend the Academy in 2023.
After completing 26 weeks of instruction at the CHP’s live-in training facility, the newly sworn officers will report to various CHP offices throughout the state.
At the CHP Academy, cadet training starts with nobility in policing, leadership, professionalism and ethics, and cultural diversity. Additionally, cadets receive instruction on mental illness response and crisis intervention techniques.
Training also covers vehicle patrol, crash investigation, first aid, and the apprehension of suspected violators, including those who drive under the influence.
Cadets also receive training in traffic control, report writing, recovery of stolen vehicles, assisting the motoring public, issuing citations, emergency scene management, and various codes, including the California Vehicle Code, Penal Code, and Health and Safety Code.
The “Join the CHP 1,000” campaign launched in 2022 to appeal to a wide array of prospective applicants who may not be aware of the life-changing opportunities that awaits with a CHP career.
Apply today and be one of the 1,000 new CHP officers ready to make a difference.
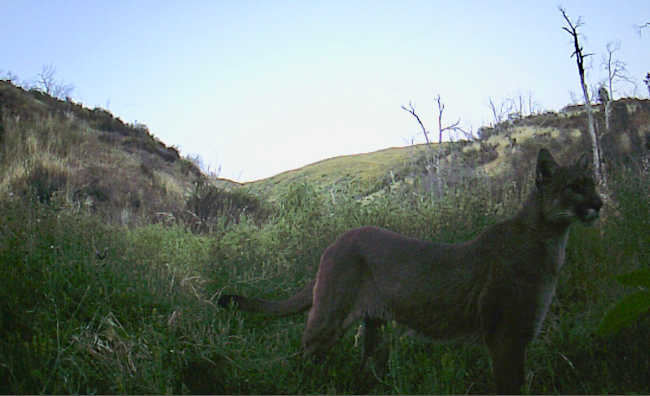
Mountain lions (Puma concolor) were often captured by game cameras on Tuleyome’s Silver Spur Ranch. Photo by Tuleyome. LAKE COUNTY, Calif. — In 2016, the Woodland-based nonprofit Tuleyome purchased 1,280-acres along a portion of the north fork of Cache Creek in Lake County.
Known as Silver Spur Ranch, the property is located in the heart of the 330,780-acre Berryessa Snow Mountain National Monument.
Since the purchase, Tuleyome has been working with multiple agencies and partners on several ongoing scientific studies.
The California Department of Water Resources has a water quality monitoring station on Cache Creek as it flows through Silver Spur.
The Department of Water Resources California Data Exchange Center installs, maintains and operates an extensive hydrologic data collection network including snow reporting gages for the Cooperative Snow Surveys Program as well as precipitation and river stage sensors for flood forecasting. The monitor has been collecting data since late 2000.
The California Department of Fish and Wildlife, or CDFW, uses Silver Spur as one of its annual deer survey locations. Their study utilizes game cameras and the collection of fecal pellets to study DNA.
The annual, five-week study has taken place since 2017, shortly after Tuleyome acquired the ranch.
While Tuleyome does not permit hunting on the property, hunters are allowed pass through the ranch to utilize the Bureau of Land Management-managed lands to the west, east, and north.
In 2018, the Pawnee fire burned through Silver Spur Ranch. Tuleyome applied for and received funding from the Sacramento Zoo to study how wildlife, especially mammals, returned to the area after the burn. A dozen wildlife cameras were set up in different habitat types to monitor the property.
The cameras provided us the opportunity to see what happens when humans are not around. It became clear that deer, bear, bobcats and mountain lions utilize Silver Spur.
The fire in 2018 also put Silver Spur on the radar of Dr. Timothy Stark from the University of Illinois -Urbana Champaign. He and his team are monitoring the impact of wildfires on landslides in Lake County.
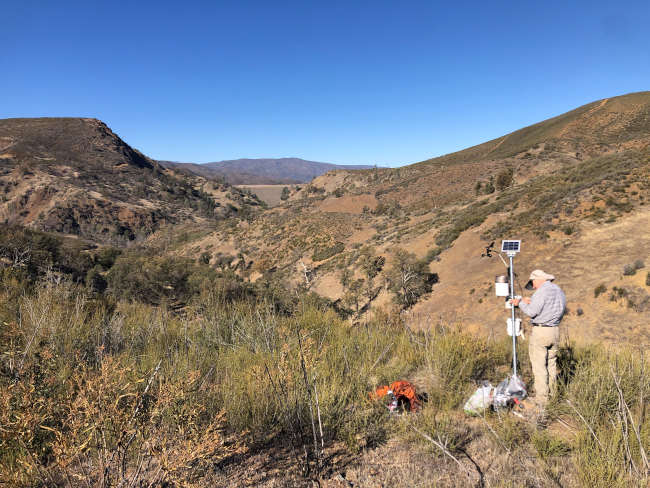
There are multiple landslides of varying sizes — some have burned, some have not. Dr. Stark has installed weather stations on Silver Spur as part of a USDA-funded study. The weather stations collect data including precipitation, wind speed and direction, temperature, and soil moisture.
The most recent study to utilize Tuleyome’s Silver Spur Ranch is CDFW’s Vegetation Classification and Mapping Program.
This program is conducting vegetation surveys in Lake County to include in their North Coast and Ranges Vegetation Classification and Mapping Project.
They will use the information to create a description of plant communities (vegetation types) and a vegetation map of a section of the North Coast, including Del Norte, Humboldt, Mendocino, and portions of Lake counties.
Tuleyome’s Silver Spur Ranch is a gorgeous place in the heart of Berryessa Snow Mountain National Monument. These studies are helping us understand the importance and uniqueness of the Monument and will provide information when the Monument Management Plan is being developed by the BLM and U.S. Forest Service.
Nate Lillge is the adventures and engagement director for Tuleyome.
Installing a weather station at Silver Spur Ranch. Photo by Nate Lillge.

 How to resolve AdBlock issue?
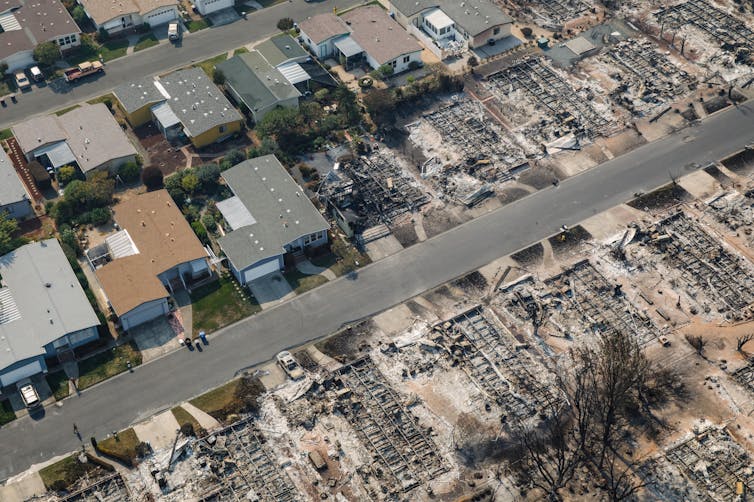


