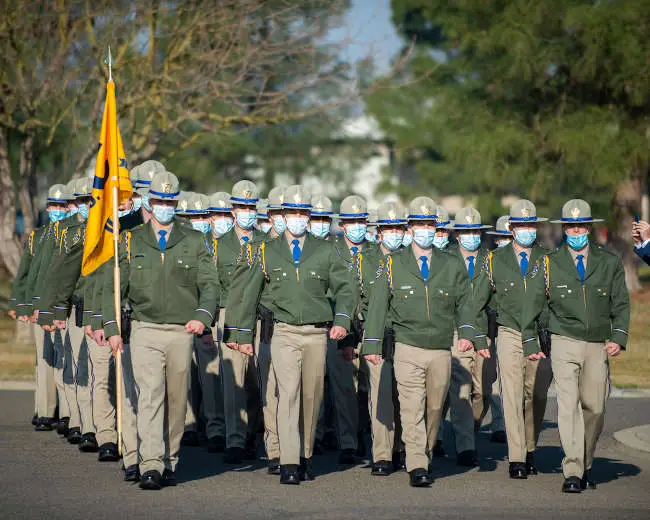
The California Highway Patrol’s 142 newest officers graduated from the CHP Academy on Friday, February 4, 2022. Photo courtesy of the CHP. NORTHERN CALIFORNIA — The California Highway Patrol’s 142 newest officers graduated from the CHP Academy on Friday and, after the swearing-in ceremony, received their badges following 27 weeks of training.
Two of the cadets have been assigned to the Clear Lake Area office, Officer Zachary Cornell and Officer Jared Wade, said CHP spokesperson Jaime Coffee.
Coffee said the two new officers will report for duty in Lake County on Monday, Feb. 14.
With family and friends looking on, each cadet was promoted to the rank of officer and took their first steps as California’s newest defenders of the law.
“I have pride knowing that these women and men will be deploying throughout our great state to serve the people of California,” CHP Commissioner Amanda Ray said. “These new officers answered the call and are embarking on a time-honored tradition of service.”
The latest class of CHP cadets at their graduation on Friday, February 4, 2022. Photo courtesy of the CHP. At the CHP Academy, cadet training starts with nobility in policing, leadership, professionalism and ethics, and cultural diversity. Cadets also receive instruction on mental illness response and crisis intervention techniques.
The training also covers vehicle patrol, accident investigation, first aid, and the apprehension of suspected violators, including those who drive under the influence of alcohol or drugs.
The cadets also receive training in traffic control, report writing, recovery of stolen vehicles, assisting the motoring public, issuing citations, emergency scene management, and knowledge of various codes including the California Vehicle Code, Penal Code, and Health and Safety Code.
Upon graduation, this class of officers will be reporting for duty to one of the 103 CHP Area offices throughout the state.
For more information about becoming a CHP officer, or to apply, visit the CHP’s website.
California Highway Patrol Commissioner Amanda Ray inspecting the cadets at graduation on Friday, February 4, 2022. Photo courtesy of the CHP.
LAKE COUNTY, Calif. — Clearlake Police Chief Andrew White reported on the past year’s crime trends and his agency’s performance during the Clearlake City Council meeting on Thursday night.
White started out by introducing new Officer Brady Crenshaw and swearing him in. Crenshaw’s wife Celeste pinned on his badge as he held their young daughter, Joy.
“We’ll take good care of him,” White told Crenshaw’s family.
White noted that COVID-19 — and the associated rules and regulations — has been an ongoing challenge for the department.
The Clearlake Police Department continued its focus on community policing in 2021, building cars for children to drive in the city’s soapbox derby, participating in library story times for children and partnering with other city departments to put on a successful Independence Day celebration.
Officers once again delivered Thanksgiving meals and Christmas gifts, and participated in the “Shop with a Cop” program for local children, White said.
Police officers were a part of the response in the August Cache fire and the department has been working on projects to boost the city’s resilience in the face of such incidents. Those projects include fiber-optic internet at the Clearlake Senior Center, extending communications capability to the fire department and working on improvements to computer-aided dispatch.
White said they’ve launched the program CueHit, which surveys community members who have called or interacted with police. It also allows the department to update people when officers will respond, send follow-up information and resources, and get an assessment on their performance.
He said he made a concerted effort to bring people into the department who care about the community. The survey results show that effort does have a linkage to the satisfaction of community members.
Crime-related statistics White reported included the following for 2021:
• Calls for service increased by 3%, up by 756 to 21,956 calls. • Arrests are trending down, totaling 2,324 in 2021, down by 148 or 6%. • Officer-initiated activities totaled 12,044, down by 25% or 3,938. Those numbers were impacted by loss of staff. • There were 3,731 reports created, up by 31, or 1%. • Police conducted 3,694 traffic stops. • There 24 more injury collisions, accounting for a 43% increase. Of those, there were three fewer fatalities, but six more major and 21 more minor collisions in 2021 compared to the previous year. Overall, Clearlake’s numbers are still not very high, White said, adding that staffing issues resulted in the agency losing the traffic officer position. “Enforcement is an important factor.” • Priority one call response time was down slightly from 6:35 to 6:25 minutes; priority two response time from 10:50 to 12:06 minutes and priority three from 13:47 to 14:01 minutes.
White said violent crime is at a seven-year slow, dropping by 18%, a trend that has been happening for the last several years. Property crime has shown a 5% increase, but remains at one of the lowest levels since the city incorporated more than 40 years ago.
Part one crimes — such as murder, robbery, assault, burglary, vehicle theft and arson — are at an all-time low, and have declined by 35% in five years, White said.
Burglary is down 4% and arson is down 82%, while vehicle thefts rose 1% and larceny increased 12%, amounts that White called “concerning.”
White said it’s difficult to pin rising crime to any one thing.
He said the $0 bail rule has had a significant impact. Originally, it was driven by the California Supreme Court, but repealed last summer and left up to each jurisdiction.
White said many courts had reinstated bail for certain crimes, but in Lake County all property-related crimes had been left at zero bail. “It created some unique situations.”
He said he’s given feedback to decision makers and has seen some progress. The matter was brought back to the Lake County Superior Court, which just made some offenses bookable again.
There also had been significant challenges in the District Attorney’s Office, which at one point had started declining to file some misdemeanor cases for a period of time, White said.
White said his department has worked with the District Attorney’s Office on direct filing some misdemeanors as infractions to help alleviate pressure on the court system.
He also noted that last year's department had 400 arrest warrants but the Superior Court has been backlogged because of COVID, resulting in a lot of cases stacking up.
Last year, Clearlake Police implemented Livescan booking and rolled out new electric mountain bikes for officers to patrol parts of the city.
It also used its automated license plate recognition program to solve 73 cases, primarily involving recoveries of stolen vehicles. White said they’ve gotten good at intercepting stolen vehicles, noting that one stolen vehicle from Los Angeles came into the city and within a few minutes they identified it and were able to intercept and recover it.
White reported the following code enforcement statistics for 2021:
• 528 property cases, down 62 from the previous year; • 834 vegetation cases, down 621; • 387 vehicles abated, up by 122; • 131 cannabis cases, down 72; • 2,203 administration citations, down 120; • 866 parking citations, up 477; • Five vacant building registrations; • 1161 abandon tags, up 496.
Clearlake Animal Control recorded 391 intakes, with 179 of those animals going to rescues and 20 being adopted. There were 324 licenses.
He said recruitment remains a challenge. Last year, they had 50 applicants for police officer positions but hired just three. For dispatchers, there were 92 applicants but just one hire. While they have another promising candidate, there is a planned retirement this summer. “Staff doing an incredible job,” White said.
In addition to recruitment and retention, a focus area has been training and leadership, White said.
He said he’s incredibly proud of the work his staff does.
“We are a statistically safer city, and we are becoming a cleaner city,” he said.
In other business on Thursday evening, the council supported sending a letter in support of the Lake Area Planning Council’s pursuit of a rural regional energy network, or RuralREN, to deliver energy efficiency programs to the community, and voted to confirm assessments for city-funded abatements on six properties.
Email Elizabeth Larson at This email address is being protected from spambots. You need JavaScript enabled to view it.. Follow her on Twitter, @ERLarson, or Lake County News, @LakeCoNews.
LAKE COUNTY, Calif. — The latest crop report for Lake County shows the total value of its agricultural products has rolled back to a level seen a decade ago, showing the impact of market pressures.
Agricultural Commissioner Steve Hajik completed the 2020 report, which was submitted to the Board of Supervisors late in 2021.
This will be the last crop report for Hajik, who retires this month after 20 years as agricultural commissioner. “That’s a record,” he told Lake County News. The previous record was 17 years.
He’ll be succeeded by Katherine Vanderwall, the deputy agricultural commissioner and sealer of weights and measures.
The 2020 crop report shows a major rollback of Lake County’s gross agricultural value, which was $75,471,368, down 30% from 2019.
Hajik’s report represents gross agricultural receipts and does not reflect production costs or net income to the producers.
He said Lake County’s agricultural value hasn’t been at this level since 2011, and is the result of market forces negatively and significantly impacting the winegrape, walnut and timber industries. At the same time, the continuing drought has impacted the field crops and cattle industries.
The county’s highest-ever ag value — $120,753,532 — was reached in 2017. Hajik said every year since then the value has declined.
“Winegrapes account for most of the value of Lake County ag these days,” Hajik said.
The gross value of winegrapes in 2020 was down 37% from 2019. Hajik said issues impacting that industry included smoke damage and labor.
The report said the total winegrape tonnage was 39,520 and the total grape acreage was 10,009, a decrease of five acres. The tons per acre decreased by 16% and the average price per ton decreased by 26%.
Pears, the county’s No. 2 crop, actually fared better. That crop’s gross value in 2020 was $16,626,482, an increase of 13% from 2019. That gross value represents the value of the pears after they are packed and processed, and doesn’t indicate the value of the pears at the time of harvest or the gross income of the producers.
Total production decreased by 3,256 tons but the price per ton increased by 30%.
“Pears did well,” said Hajik.
He said he believes that was because of market changes brought on by COVID, with people staying home more and canned fruit operations doing quite well. “That’s my best guess.”
While pears had fewer acres, Hajik said the best acres remain in place.
The gross value of walnuts was $1,047,600, a decrease of 49% and the production decreased by 3%. The price per ton decreased by 43% and acreage remained the same, the report showed.
He expects the 3,500 acres of walnut acreage will be halved by 2022 due to the declining market.
Hajik pointed out a number of areas where there were increases. Among the most notable was miscellaneous livestock, which increased by 10,995%, rising from $110,000 to $1.2 million.
There also were increases in nursery production, 39%, and vegetables, 220%.
Decreases were reported in miscellaneous fruit; 4%; livestock and poultry production, 40%; cattle, 14%; field crops, 28%; and timber, 98%.
Hajik said timber went from $1.6 million to $31,000, which he attributed to fires and salvage logging, which is much cheaper than normal logging. “If you sold your timber now, you’d be losing money.”
For the first time, the crop report included industrial hemp, which Hajik said was done at the behest of Supervisor Bruno Sabatier.
He said Lake County only had three growers and eight acres of hemp. “It’s not really taking off.”
The report does not include cannabis, which for the purposes of reporting isn’t considered an agricultural crop, Hajik said.
The state, which is responsible for registering cannabis growers, has indicated it may be coming up with some basic information for agriculture commissioners to include in their reports, such as the number of growers, acres and value. So far, however, “That’s only talk,” Hajik said.
Asked about the biggest changes he’s seen in the report during his time as agriculture commissioner, Hajik said it’s the reduced acres of the pear industry.
In 2003, Lake County had 3,000 acres of pears. It’s now at 1,400 acres; Hajik said it’s expected the county will lose 200 more acres this year.
“The value of tons per acre has gone up,” Hajik said, rising from $348 per ton in 2003 to $733 per ton in 2020.
At the same time, grapes have almost doubled in acres and walnuts have stayed about the same. “Those are the biggest changes,” Hajik said.
Email Elizabeth Larson at This email address is being protected from spambots. You need JavaScript enabled to view it. . Follow her on Twitter, @ERLarson, or Lake County News, @LakeCoNews.
CLEARLAKE, Calif. — The Rotary Club of Clear Lake announced that it will host its annual Seafood Boil and Auction presented by Adventist Health on Saturday, Feb. 26.
The event will take place at the Clearlake Community Center, located at 3245 Bowers Ave. Doors open at 5:30 p.m.
The center has been the beneficiary of two recent Rotary initiatives, including the installation and expansion of the emergency evacuation center under leadership of the Lake Area Rotary Club Association, and soon-to-be-installed outdoor fitness equipment for the Highlands Senior Center.
This year proceeds from the event will be directed towards youth athletics and enhancements to the developing Burns Valley Sports Complex to be built by the city of Clearlake nearby, reaffirming the club’s commitment to better health opportunities for the community.
"Adventist Health Clear Lake is proud to support the Clear Lake Rotary Seafood Boil Fundraiser,” said David Santos, president of Adventist Health Clear Lake. “We believe it is important to support local organization’s efforts to improve and make a positive impact in the overall well-being of the community.”
The seafood boil fundraiser will host live and silent auctions, with a full bar featuring wine from Brassfield Estate Winery.
“Our club has never been more determined to find ways to support education, healthy living, and strengthen the bonds that have served all of us so well after countless disasters and hardships,” said Andrew Pierson, Rotary Club of Clear Lake’s president. “In the two years since our last boil I’ve seen amazing resilience and strength among the people of this county. Through this event we’ve been able to initiate projects that have made an impact for residents, and we look forward to continuing that tradition.”
To sponsor or reserve a table, contact the Rotary Club of Clearlake at This email address is being protected from spambots. You need JavaScript enabled to view it..
CLEARLAKE, Calif. — Clearlake Animal Control has a full house of adoptable dogs this week.
The City of Clearlake Animal Association also is seeking fosters for the animals waiting to be adopted.
Call the Clearlake Animal Control shelter at 707-273-9440, or email This email address is being protected from spambots. You need JavaScript enabled to view it. to inquire about adoptions and schedule a visit to the shelter.
Visit Clearlake Animal Control on Facebook or on the city’s website.
The newest dogs are listed at the top of the following list.
“Andy.” Photo courtesy of Clearlake Animal Control. ‘Andy’
“Andy” is a male American pit bull mix with a short gray and white coat.
He is dog No. 48995415.
“Annie.” Photo courtesy of Clearlake Animal Control. ‘Annie’
“Annie” is a female Labrador retriever mix with a short black coat.
She is dog No. 49409961.
“Arnold.” Photo courtesy of Clearlake Animal Control. ‘Arnold’
“Arnold” is a male American Staffordshire terrier mix with a short brindle coat with white markings.
He is dog No. 49029348.
“Bear.” Photo courtesy of Clearlake Animal Control. ‘Bear’
“Bear” is a male Labrador retriever-American pit bull mix with a short charcoal and fawn coat.
“Bear No. 2” is a male American pit bull mix with a short tan coat.
He has been neutered.
He is dog No. 48731556.
“Bella.” Photo courtesy of Clearlake Animal Control. ‘Bella’
“Bella” is a female American pit bull mix with a short gray brindle coat.
She has been spayed.
She is dog No. 48448381.
“Chai.” Photo courtesy of Clearlake Animal Control. ‘Chai’
“Chai” is a female Alaskan husky mix with a gray and white coat.
She has been spayed.
She is dog No. 49279552.
“Claire.” Photo courtesy of Clearlake Animal Control. ‘Claire’
“Claire” is a female border collie mix with a short black and white coat.
She has been spayed.
Claire is dog No. 49397880.
“Ebenezer.” Photo courtesy of Clearlake Animal Control. ‘Ebenezer’
“Ebenezer” is a male American pit bull terrier mix with a short tan and white coat.
He is dog No. 49191651.
“Edgar.” Photo courtesy of Clearlake Animal Control. ‘Edgar’
“Edgar” is a male terrier-American pit bull mix with a black and cream coat.
He has been neutered.
He is dog No. 48634546.
“Fritz.” Photo courtesy of Clearlake Animal Control. ‘Fritz’
“Fritz” is a male Australian shepherd mix with a black and white coat.
He is dog No. 49278179.
“Isabella.” Photo courtesy of Clearlake Animal Control. ‘Isabella’
“Isabella” is a female Chihuahua mix with a short tan coat.
She is dog No. 49292130.
“Jaxx.” Photo courtesy of Clearlake Animal Control. ‘Jaxx’
“Jaxx” is a male Doberman pinscher mix with a black and rust-colored coat.
He has been neutered.
He is dog No. 49022184.
“Levi.” Photo courtesy of Clearlake Animal Control. ‘Levi’
“Levi” is a male golden retriever-Labrador retriever mix.
He has a short golden coat.
He is dog No. 48975687.
“Maria.” Photo courtesy of Clearlake Animal Control. ‘Maria’
“Maria” is a female Shar-Pei mix with a short tan coat.
She is dog No. 49047315.
“Maui.” Photo courtesy of Clearlake Animal Control. ‘Maui’
“Maui” is a male Labrador retriever mix with a short black coat and white markings.
He is dog No. 49334317.
“Nala.” Photo courtesy of Clearlake Animal Control. ‘Nala’
“Nala” is a 1-year-old female German shepherd mix.
She has a medium-length black and tan coat.
She is dog No. 48289638.
“Noodle.” Photo courtesy of Clearlake Animal Control. ‘Noodle’
“Noodle” is a male Alaskan husky mix with a black and white coat.
He is dog No. 49375787.
“Priscilla.” Photo courtesy of Clearlake Animal Control. ‘Priscilla’
“Priscilla” is a female Brittany spaniel mix with a white and copper coat.
She is dog No. 49089138.
“Sassy.” Photo courtesy of Clearlake Animal Control. ‘Sassy’
“Sassy” is a female American pit bull mix with a short black coat.
She has been spayed.
She is dog No. 48443128.
“Snowball.” Photo courtesy of Clearlake Animal Control. ‘Snowball’
“Snowball” is a male American Staffordshire mix terrier with a white coat.
He is dog No. 49159168.
“Terry.” Photo courtesy of Clearlake Animal Control. ‘Terry’
“Terry” is a male shepherd mix with a short brindle coat.
He is dog No. 48443693.
“Turk.” Photo courtesy of Clearlake Animal Control. ‘Turk’
“Turk” is a male chocolate Labrador retriever mix.
He is dog No. 48911836.
Email Elizabeth Larson at This email address is being protected from spambots. You need JavaScript enabled to view it.. Follow her on Twitter, @ERLarson, or Lake County News, @LakeCoNews.
Members of California Highway Patrol Cadet Training Class I-21 make their way to the California Peace Officers’ Memorial on Wednesday, February 2, 2022. Photo courtesy of the CHP. NORTHERN CALIFORNIA — The California Highway Patrol this week will graduate the latest cadet training class, which will provide new officers to CHP offices throughout the state.
The CHP said 142 members of Cadet Training Class I-21 participated in a five-mile run from the Academy in West Sacramento to the California Peace Officers’ Memorial early Wednesday morning.
This run is a ceremonial rite-of-passage for the cadets and signifies the end of their six-months of training, the CHP reported.
At the memorial, the CHP said the cadets honored the more than 1,600 law enforcement officers who came before them and made the ultimate sacrifice serving the people of California.
The CHP said it will swear in the new officers at a graduation ceremony at the CHP Academy on Friday.
Following the graduation ceremony, the new officers will serve in communities throughout the state.
Officer Efrain Cortez of the Clear Lake Area office said two of the new officers will be coming to Lake County and will start their training here.
On Friday, Gov. Gavin Newsom issued a proclamation declaring February 2022 as Black History Month.
The governor also released a video commemorating the observance, which can be seen above.
The proclamation, which explains the history of Black History Month, can be read in its entirety below.
PROCLAMATION
This month, we pay homage to the rich history and contributions of African Americans who have shaped our state and nation in innumerable ways. First proposed by scholar Carter G. Woodson in 1926, Black History Month rightfully centers the struggles and triumphs of African-Americans to tell a fuller story of America and the diverse communities that built it.
This year’s theme, Black Health and Wellness, lifts up the contributions of African-Americans to medicine while shining a light on persistent health disparities impacting the community. California is committed to closing these equity gaps by making health care, including mental health services, more accessible than ever before and expanding support for the most vulnerable among us.
With the maternal and infant mortality rate among African-Americans significantly higher than the state average, I was honored to sign the landmark Momnibus Act last year to advance our efforts in tackling the socio-economic factors and structural racism at the heart of these preventable tragedies. Building on the state’s Black Infant Health Program, Perinatal Equity Initiative and other targeted supports, we’ve added Medi-Cal coverage for doulas, extended Medi-Cal eligibility for postpartum individuals, provided easier access to CalWORKs for pregnant people, and required perinatal health care providers to undergo implicit bias training.
Throughout the pandemic, California has taken action to address the disproportionate toll on communities of color. Through robust partnerships with faith leaders, community-based organizations and ethnic media, the state has kept equity at the center of our COVID vaccination and testing outreach, meeting Californians where they are with culturally-competent engagement and information. As our recovery continues, we’re not letting up on this focus to tackle the wide-ranging disparities laid bare by the pandemic to ensure that all Californians have an opportunity to reach their dreams.
As we honor the accomplishments and history of African-Americans this month, we reflect on the injustices of the past that shape our present. Together, we’ll continue to make strides toward a California for All that supports the health and well-being of all our communities and where all families can thrive.
NOW THEREFORE I, GAVIN NEWSOM, Governor of the State of California, do hereby proclaim February 2022, as “Black History Month.”
IN WITNESS WHEREOF I have hereunto set my hand and caused the Great Seal of the State of California to be affixed this 3rd day of February 2022.
GAVIN NEWSOM Governor of California
ATTEST: SHIRLEY N. WEBER, Ph.D. Secretary of State
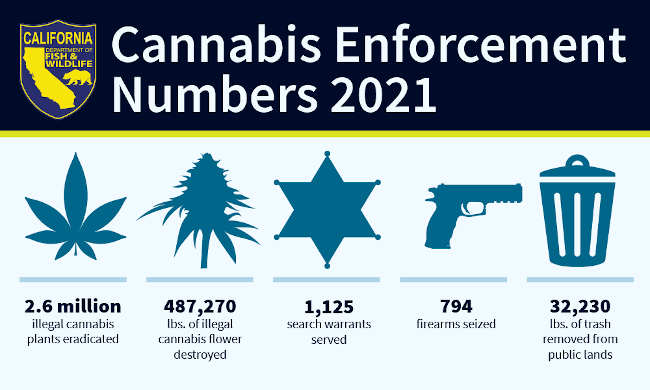
The California Department of Fish and Wildlife’s Cannabis Enforcement Program has released year-end numbers for the 2021 calendar year.
CDFW investigates illegal cannabis cultivation operations to uncover and curtail operations that result in significant environmental damage.
Some of the most serious environmental issues involve unauthorized streambed alterations with water diversions, habitat destruction, illegal use of pesticides and poaching.
CDFW does not typically investigate water theft but will assist county law enforcement partners in such investigations as needed.
“Illegal operators who are trying to bypass the legal system are a threat to California’s fish and wildlife resources, and a detriment to those legally cultivating cannabis,” said David Bess, CDFW deputy director and chief of the Law Enforcement Division. “Our wildlife officers did an exceptional job in providing public safety alongside our federal, state and county partners and I could not be prouder of their dedication and commitment to protecting the environment. Our year-end numbers are a testament to all their hard work throughout the year.”
Some of the year’s notable statistics include:
• 2.6 million illegal cannabis plants eradicated; • 487,270 lbs. of illegal cannabis flower destroyed; • 1,125 search warrants served; • 794 firearms seized; • 32,230 lbs. of trash removed from public lands; • 404 illegal water diversions removed.
These numbers reflect all operations where CDFW was either the lead agency or in a support role.
According to statistics from the Department of Justice’s Campaign Against Marijuana Planting program, or CAMP, illegal cannabis cultivation continues to move away from public land operations to private property.
In 2018, the ratio of illegal activity was approximately 80% on public lands and 20% on private property. The number of illegal cannabis grows on public lands has continued to decrease steadily over the last few years and in 2021, the Department of Justice’s CAMP program cited less than 30% of illegal cultivation activity on public lands.
CDFW has 68 dedicated cannabis enforcement officers who work with county, state and federal partners to combat illegal cultivation activity.
The agency encourages the public to report environmental crimes such as water pollution and poaching to the CalTIP hotline by calling 888-334-2258 or by texting information to “TIP411” (847411).
There were 37.3 million people in poverty in 2020, according to the official poverty measure. In contrast, there were 29.8 million people in poverty that same year, according to the Supplemental Poverty Measure.
While these measures may seem at odds with each other, they each present a different angle of poverty in the United States.
In recognition of National Poverty in America Awareness Month this month, the U.S. Census Bureau is highlighting two poverty measures it uses to capture a clearer picture of poverty and equity in the United States.
The first — the official poverty measure first published in the mid-1960s — is based on cash resources.
The second — the Supplemental Poverty Measure (SPM) — includes both cash and noncash benefits and subtracts necessary expenses (such as taxes and medical expenses).
The 2020 SPM rate of 9.1%, the most recent available, was the lowest since the measure was first published in 2009, and the first time the SPM rate was lower than the official poverty rate.
Differences between poverty measures
The official poverty measure has remained mostly unchanged since the mid-1960s, but the SPM was designed to keep pace with changes in data, methods, and new research.
The table below shows a detailed comparison of major concepts between the two measures. (The history of poverty measures in the United States infographic, “How the U.S. Census Bureau Measures Poverty,” and this blog on the difference between SPM and official poverty measures provide more details.)
Official poverty measure
The official poverty measure compares an individual’s or family’s pretax cash income to a set of thresholds that vary by family size and the ages of family members.
These official poverty calculations do not account for the value of in-kind benefits such as nutritional assistance, housing and energy programs, or tax credits like the earned income tax credit or stimulus payments.
They also do not consider regional differences in living costs or expenses such as housing.
Supplemental poverty measure
On the other hand, the SPM does consider family resources and expenses not included in the official measure as well as geographic variation.
First, it adds the value of refundable tax credits and in-kind benefits available to buy basic goods to cash income. In-kind benefits include nutritional assistance, subsidized housing, and home energy assistance.
Then, it subtracts necessary expenses for critical goods and services not included in the thresholds from resources.
Necessary expenses subtracted include income taxes, Social Security payroll taxes, child care and other work-related expenses, child support payments to another household and medical care and health insurance premium contributions.
The Bureau of Labor Statistics’ Division of Price and Index Number Research produces the SPM income thresholds based on Consumer Expenditure Survey data that show how much people spend on basic necessities (food, clothing, shelter and utilities) and are adjusted for geographic differences in housing costs.
The SPM thresholds are not intended to assess eligibility for government assistance.
Official vs. supplemental poverty rates
In September 2021, the Census Bureau released the 11th SPM report for 2020. The report presented estimates of both the official and Supplemental Poverty measures and outlined differences between the two.
From 2009 through 2019, the SPM ranged from 0.6 to 1.6 percentage points higher than the official measure (Figure 1).
In contrast, the 2020 SPM was 2.3 percentage points lower than the official measure. This was the first time in the history of the SPM that its poverty rate was lower than the official poverty rate. SPM rates in 2020, which included stimulus payments, were at their lowest level since the first-published SPM estimates.
A recent America Counts story, “Who Was Lifted Out of Poverty by Stimulus Payments?”, showed that without stimulus payments, the supplemental poverty rate would have increased by approximately 3.6 percentage points.
In 2020, SPM rates were:
• Higher than official poverty rates in 11 states plus the District of Columbia. • Lower than official poverty rates in 30 states. • Not statistically different in nine states.
Poverty across age groups
While the SPM rate for children declined between 2019 and 2020, the official poverty rate increased over the same period, widening the gap between the two measures from 1.8 percentage points in 2019 to 6.3 percentage points in 2020 (Figure 3).
SPM rates for individuals ages 18 to 64 were also lower than official poverty rates in 2020, for the first time in the history of the SPM.
The gap between the official and SPM rates for individuals 65 and older declined from 3.9 percentage points in 2019 to 0.5 percentage points in 2020. SPM rates for each major age group in 2020 were at their lowest level since 2009.
Estimates in this story were calculated using the SPM universe, which includes unrelated individuals under age 15.
More details on the impact of policies and programs on the SPM rate are available in the 2020 SPM Report. Additionally, more information on confidentiality protection, methodology, sampling and nonsampling error and definitions is available.
Frances Chen is a survey statistician in the Census Bureau’s Poverty Statistics Branch. Kalee Burns is an economist in the Census Bureau’s Poverty Statistics Branch.
What's up for February? Jupiter makes its exit, Venus at peak brightness and the star-forming cloud next door.
With the departure of Saturn and Venus over the past two months, Jupiter is the only bright planet left in our twilight skies in February, and it's on its way out.
The giant planet stands alone, low in the western sky after sunset in February. By mid-month, it's setting only about an hour after the Sun.
Once Jupiter departs at the end of February, the post-sunset sky will be essentially devoid of naked-eye planets until August, when Saturn will start rising in the east around sunset. (There's a short period, though, in April and May when you might be able to spot Mercury as it pops briefly above the horizon.)
You'd have to go back four years, to March of 2018, to find twilight skies with no bright planets. So catch Jupiter before it's gone. And look for it to become a morning planet in April.
Speaking of morning skies, the planet Venus will be at its brightest for the year in February, around mid-month. It rises with Mars around 4 a.m. and is visible low in the southeast until sunrise. Venus is the brightest of all the planets in our solar system because of the highly reflective clouds that completely cover its globe.
But its brightness in our skies varies, depending on how far it is from Earth and on its phase. Turns out Venus is brightest not when it's closest to Earth, but when it's almost at its closest and still shows us a large, bright crescent phase.
So enjoy the crescent Venus that is the planet at its brightest. And look for Venus to form a trio with the Moon and Mars on the morning of Feb. 26.
February is a perfect time to enjoy one of the most popular and well-studied sights in the night sky: the Great Nebula in Orion.
The Orion Nebula is an enormous cloud of gas and dust where thousands of stars are being born. In fact, it's the nearest large star-forming region to our solar system, at around 1,500 light years away.
The bright, central region of the Orion nebula is a giant cavity in the cloud being carved out by the intense ultraviolet light from a handful of extremely massive young stars.
Finding the Orion Nebula is easy on February nights, as the constellation Orion will be high in the south around 8 or 9 p.m.
Look for the three stars of the hunter's belt, and then find the stars that hang below it forming Orion's sword. In the center of this line of stars is one that looks kind of fuzzy. That's the nebula. It's visible to the unaided eye under relatively dark skies, and is easily seen with binoculars as a faint haze. And through a telescope, it's a sight you'll never forget.
Stay up to date with all of NASA's missions to explore the solar system and beyond at nasa.gov.
Preston Dyches works for NASA's Jet Propulsion Laboratory.
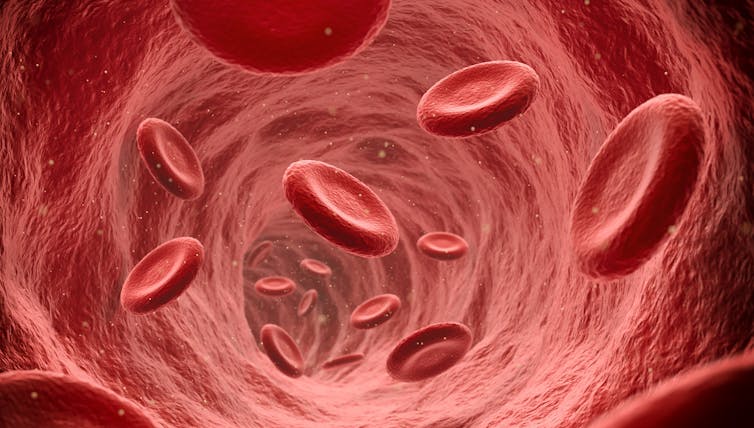
The blood supply in the U.S. is now at its lowest level in over a decade.
Many of the nation’s blood centers currently have only a one-day supply of some blood types in inventory. This is dangerous because blood transfusions are needed for many surgeries. Blood is also used in the treatment of diseases like sickle cell anemia and certain cancers – and is critical to help those who suffer injuries from accidents or disasters.
In January 2022, the American Red Cross declared its first-ever national blood crisis. A joint statement by the American Hospital Association, the American Medical Association and the American Nurses Association said that the “severity and duration of this shortage could significantly jeopardize the ability of health care providers to meet the many urgent needs of our patients and communities.”
A consistent supply of blood is essential to the nation’s health. Blood is a precious lifesaving product that cannot be manufactured but must be donated. No substitute for blood exists.
Each day the U.S. needs about 29,000 units of red blood cells, 5,000 units of platelets and 6,500 units of plasma, according to the American Red Cross. The average blood transfusion is for three units, with a victim of a car accident requiring as many as 100. A single donation can help more than one patient. Convalescent plasma may even be used as a treatment against COVID-19, a possibility our team has been researching.
At the onset of the pandemic in the winter of 2020, with growing fear and uncertainty, blood collections at many schools and other sites that traditionally hosted mobile blood drives closed. Throughout the nation, elective surgeries were canceled and procedures to preserve blood put into place.
Even before the pandemic, blood service organizations faced many challenges – including economic ones – and the U.S. blood supply chain was going through major shifts. In pre-pandemic times, less than 10% of the U.S. population would donate blood in a given year, although 38% were eligible. Moreover, blood is perishable, with red blood cells lasting 42 days, and platelets only five days, so regular replenishment is essential.
The American Red Cross reports that since March 2020, blood donations have decreased by 10%, with a decrease of 62% in college and high school blood drives as many of those locations went remote. This age group represented about a quarter of all the donors in 2019, with a drop to about 10% of all donors during the pandemic.
Most recently, donors who have tested positive with the highly transmissible omicron variant have had to cancel scheduled appointments for donating blood. The U.S. Food and Drug Administration recently released guidelines with updated information for blood establishments regarding blood donations in the pandemic. Donating blood is itself safe and, importantly, according to the FDA, globally there have been “no reported cases of transfusion-transmitted coronavirus, including SARS-CoV-2.”
The American Red Cross provides about 40% of the blood and blood components that are needed in the U.S.. Donors can also donate blood at local community blood centers or hospitals, at Vitalant – formerly United Blood Services – or at member organizations of America’s Blood Centers. These make up North America’s largest network of nonprofit community blood centers and operate more than 600 blood donation collection sites.
Blood donations have dropped by 10% since the beginning of the pandemic, according to the American Red Cross.Kmatta/Moment via Getty Images
Not just numbers
When it comes to blood shortages, people’s lives are on the line, and the stories are very personal.
A young pregnant mother in Louisiana who was suffering from COVID-19 and internal bleeding survived just long enough to see her newborn daughter, thanks to blood donations. An 11-year-old girl in West Virginia who is battling bone cancer has received 18 blood transfusions. An 8-year-old girl in Texas is suffering from T-cell leukemia and relies on blood donations, but numerous blood drives in her area were canceled. These are just a few examples.
The blood supply chain is incredibly complex. It consists of the collection of donations, testing, processing and distribution, with ultimate transfusion to recipients at health care facilities. Along with “getting blood from donor to recipient,” ample supplies are needed for collection, testing and transfusion.
Less well recognized, but of immense importance, is the labor required in this supply chain, which, along with the donors, serves as the backbone. Throughout the pandemic, workers have been getting sick from COVID-19 and many have, sadly, lost their lives. The reduction in labor availability, along with decreases in productivity, have affected supply chains from food to health care.
With COVID-19 infection rates surging across the nation, blood collection services are also suffering from labor shortfalls, including of blood collection specialists. The Red Cross is reporting that staffing shortages in parts of the country are among the biggest hurdles now, with higher wages being offered in this health care sector to attract workers.
[Over 140,000 readers rely on The Conversation’s newsletters to understand the world.Sign up today.]
Easing restrictions – such as those on gay and bisexual men – could increase the availability of blood by about 2% to 4%. This is now being considered. As we approach the third year of the pandemic, the need for blood donations and for supporting this complex supply chain is even greater than at the onset of the pandemic.
Andrew Moreo, Florida International University; Imran Rahman, Auburn University; Lisa Cain, Florida International University, and Trishna G. Mistry, University of South Florida
This has created huge problems for restaurants, hotels and other leisure and hospitality businesses that have struggled to find workers for record numbers of job openings in 2021.
A big part of this decline seems to be explained by the “great resignation.” Leisure and hospitality workers are quitting at the highest rates of any industry. About 1 million quit in November 2021 alone. And the data suggests many of them are not simply swapping one hospitality job for another but leaving the industry entirely.
Why are these workers quitting, where are they going and what can be done to bring them back?
We recently commissioned a survey aimed at tracking down some of these workers and answering these questions. The research is ongoing, but our early qualitative results offer some clues to answering these questions.
Reasons for attrition
Before we get to our early data, there are several characteristics of leisure and hospitality work that help explain why the industry has unusually high turnover rates.
For one thing, the wages are very low. Leisure and hospitality workers were earning an average of $515 a week – including tips – as of December 2021, making them the worst-paid of all sectors, according to Bureau of Labor Statistics data. That’s less than half of the average for all private workers and translates into annual income of under $27,000 – based on 52 weeks of pay.
This puts financial stress on these employees, often forcing them to work multiple jobs to get by.
The working hours are also challenging, often involving nights, weekends and holidays, which means hospitality workers routinely miss out on time with friends and family, limiting opportunities to recharge their emotional batteries.
Moreover, the nature of the jobs in this sector are particularly stressful and emotionally draining. In fact, sociologists and economists have a phrase for this: emotional labor. This concept refers to the suppression of whatever emotions an employee may be experiencing to provide good service to a customer – and often “with a smile.”
In hospitality, employees must regulate the outward expression of their emotions to the benefit of the customer and their employer, regardless of what they are feeling. Sometimes this puts little or no burden on the employee, but at other times it takes a great emotional toll.
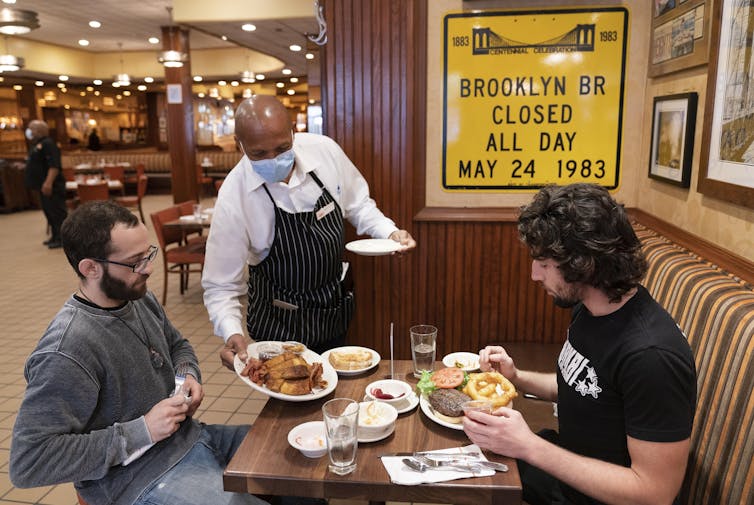
The new stressors include massive furloughs and layoffs since March 2020, significant risks to personal health by having little choice but to work at a physical location where workers regularly are in close proximity to colleagues and customers, as well as fights with patrons over enforcing mask bans and vaccine mandates. The news media regularly report on angry and even violent confrontations between customers and service workers, whether on planes, in restaurants or in other types of establishments.
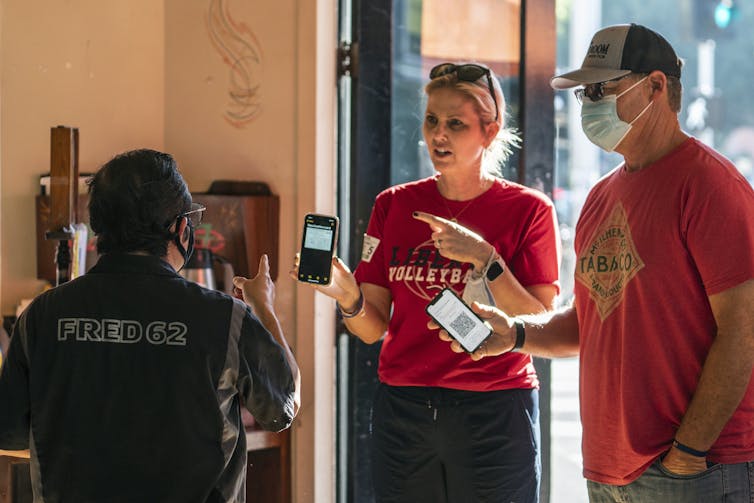
Hospitality workers are required to enforce vaccine and mask mandates, which has led to altercations.AP Photo/Damian Dovarganes
Finding the ‘quitters’
While there’s been a ton of coverage of the sector’s record quit rate of 6.4% in November – the latest data available – there’s less hard data on why hospitality workers are leaving their jobs now and where they are going.
So as part of an ongoing project studying employee attrition, we asked Qualtrics – an employee and customer experience data-gathering company – to find people who worked in the hospitality sector before and during the COVID-19 pandemic and have since left the industry – a process that was exceedingly difficult.
We completed a qualitative unpublished pilot study in December 2021 to help inform a larger quantitative survey we’re working on right now. Our initial results, which include open-ended responses from 31 people, aren’t necessarily representative of all or even most workers who have quit their jobs but allow us to paint a more complete picture of what’s driving the decisions of these specific individuals. We asked them why they left, where they went and what could lure them back to a hospitality job.
We used their answers to construct questions that are appropriate for in-depth statistical analysis, which will then be administered to 350 people who agree to take part in the quantitative survey. Results of that survey will be available in a couple months.
Why people are leaving
Our first question focused on what drove people to not only quit their jobs but leave the hospitality sector. The most common responses related to health and safety concerns, burnout and issues involving managers or co-workers.
One of our respondents was a 35-year-old single mother who said she had been working in the food service industry for about five years before the pandemic hit. She quit her job four months later.
“My safety and my family’s safety were on the line and I was being overworked,” she said.
A 20-year-old man said he left the hotel industry during the pandemic after five years “because I truly wasn’t happy” and “didn’t have the will to keep going on.”
Another 35-year-old woman said she quit her job on a cruise ship because she cares for her elderly parents, who would be more at risk were they exposed to COVID-19.
“They didn’t care about our well-being,” she said. “I have family at home that can die if exposed to COVID.”
Where did they go
As for what the people in our survey decided to do after leaving the industry, the most common answer was to get more education. But others emphasized a desire to go into business for themselves or to a different type of service job, such as in retail.
A 21-year-old man who had been working at nightclubs for over three years said he quit to go to college.
Both the 35-year-old single mother and 20-year-old man said they decided to become self-employed.
Another 23-year-old single mother who had worked in food service before and during the pandemic left for retail, stating: “I got another job as a cashier and it was the only thing I could find at that moment.”
Would they go back
Most of our participants told us nothing would bring them back to these types of jobs – they were done with the industry. The 35-year-old single mother, for example, said there was nothing that could be done to bring her back now that she had moved on with her own business.
But others said better money or hours would help lure them back, as well as stronger managerial support.
[Over 140,000 readers rely on The Conversation’s newsletters to understand the world.Sign up today.]
A 42-year-old woman who spent nearly a decade in the food service industry said she would return for “better pay and more respect,” a sentiment echoed by others.
An 18-year-old woman said she quit a food service job because of a manager with a “really bad temper” who would “cuss at customers and employees.” She said that the only way she would go back to hospitality work is if a company showed her “that managers are actually there to help employees.”
“I would also like customers to be more patient and humble,” she added.

 How to resolve AdBlock issue?