LAKE COUNTY, Calif. — Lake County Animal Care and Control has a new group of dogs waiting for adoption this week.
Dogs available for adoption this week include mixes of Alaskan husky, American blue heeler, Anatolian shepherd, Australian shepherd, border collie, German shepherd, Great Pyrenees, Labrador retriever, pit bull, Queensland heeler, Rottweiler, shepherd and terrier.
Dogs that are adopted from Lake County Animal Care and Control are either neutered or spayed, microchipped and, if old enough, given a rabies shot and county license before being released to their new owner. License fees do not apply to residents of the cities of Lakeport or Clearlake.
Those dogs and the others shown on this page at the Lake County Animal Care and Control shelter have been cleared for adoption.
Call Lake County Animal Care and Control at 707-263-0278 or visit the shelter online for information on visiting or adopting.
The shelter is located at 4949 Helbush in Lakeport.
Email Elizabeth Larson at This email address is being protected from spambots. You need JavaScript enabled to view it.. Follow her on Twitter, @ERLarson, or Lake County News, @LakeCoNews.
LAKE COUNTY, Calif. — The latest state report on unemployment shows that California’s rate rose slightly in February but Lake County’s went down.
The Employment Development Department said Friday that California’s unemployment rate increased to 5.3% in February, up from 5.2% in January, with a loss of 3,400 nonfarm payroll jobs. The state’s jobless rate in February 2023 was 4.5%.
In Lake County, unemployment in February was 7%, an improvement over the 7.4% rate reported in January. Lake’s February 2023 unemployment rate was 6.3%.
On the national level, the Bureau of Labor Statistics said the unemployment rate in February was 3.9%, up from 3.7% in January and 3.6% in February 2023. That’s the highest rate since January 2022.
Lake County’s total farm jobs rose by 13.5% while total nonfarm was up by 1.2% over January, the report showed.
Industries in Lake County with the largest job growth included wholesale trade, 14.3%; goods producing, 3.5%; and professional and business services, 2.7%. Only one industry reported a decrease — transportation, warehousing and utilities, which dropped by 1.5%.
California’s jobs market expansion turned 46 months old in February 2024. California has gained 3,037,600 jobs since the pre-pandemic peak in February 2020, which averages out to 66,035 per month.
The number of Californians employed in February was 18,321,900, a decrease of 20,100 persons from January’s total of 18,342,000 and down 82,600 from the employment total in February 2023, the report said.
At the same time, the EDD said the number of unemployed Californians was 1,027,000 in February, an increase of 13,100 over the month and up 165,400 in comparison to February 2023.
The report said California's downward-revised January 2024 nonfarm jobs total mirrors the nation, which also saw a large downward revision of approximately 124,000 jobs.
California’s number of jobs in the agriculture industry decreased from January by 2,100 to a total of 425,000 jobs in February. The agriculture industry had 26,100 more farm jobs in February 2024 than it did in February a year ago, the report said.
Lake County’s jobless rate ranked it No. 35 out of California’s 58 counties.
San Mateo County had the lowest unemployment rate in the state in February, 3.7%.
In related data that figures into the state’s unemployment rate, the EDD said there were 425,760 people certifying for Unemployment Insurance benefits during the February 2024 sample week. That compares to 392,541 people in January and 380,768 people in February 2023.
Concurrently, EDD said 41,260 initial claims were processed in the February 2024 sample week, which was a month-over decrease of 5,936 claims from January, but a year-over increase of 677 claims from February 2023.
Email Elizabeth Larson at This email address is being protected from spambots. You need JavaScript enabled to view it.. Follow her on Twitter, @ERLarson, or Lake County News, @LakeCoNews.
Solar eclipses happen because of a few factors, including the Moon’s size and distance from the Sun. AP Photo/Timothy D. Easley
On April 8, 2024, millions across the U.S. will have the once-in-a-lifetime chance to view a total solar eclipse. Cities including Austin, Texas; Buffalo, New York; and Cleveland, Ohio, will have a direct view of this rare cosmic event that lasts for just a few hours.
While you can see many astronomical events, such as comets and meteor showers, from anywhere on Earth, eclipses are different. You need to travel to what’s called the path of totality to experience the full eclipse. Only certain places get an eclipse’s full show, and that’s because of scale.
The relatively small size of the Moon and its shadow make eclipses truly once-in-a-lifetime opportunities. On average, total solar eclipses are visible somewhere on Earth once every few years. But from any one location on Earth, it is roughly 375 years between solar eclipses.
I’m an astronomer, but I have never seen a total solar eclipse, so I plan to drive to Erie, Pennsylvania, in the path of totality, for this one. This is one of the few chances I have to see a total eclipse without making a much more expensive trip to someplace more remote. Many people have asked me why nearby eclipses are so rare, and the answer is related to the size of the Moon and its distance from the Sun.
Those in the path of totality will have the opportunity to see a total solar eclipse this April.
Size and scale
You can observe a solar eclipse when the Moon passes in front of the Sun, blocking some or all of the Sun from view. For people on Earth to be able to see an eclipse, the Moon, while orbiting around the Earth, must lie exactly along the observer’s line of sight with the Sun. Only some observers will see an eclipse, though, because not everyone’s view of the Sun will be blocked by the Moon on the day of an eclipse.
The fact that solar eclipses happen at all is a bit of a numerical coincidence. It just so happens that the Sun is approximately 400 times larger than the Moon and also 400 times more distant from the Earth.
So, even though the Moon is much smaller than the Sun, it is just close enough to Earth to appear the same size as the Sun when seen from Earth.
For example, your pinky finger is much, much smaller than the Sun, but if you hold it up at arm’s length, it appears to your eye to be large enough to block out the Sun. The Moon can do the same thing – it can block out the Sun if it’s lined up perfectly with the Sun from your point of view.
Path of totality
When the Earth, Moon and Sun line up perfectly, the Moon casts a shadow onto the Earth. Since the Moon is round, its shadow is round as it lands on Earth. The only people who see the eclipse are those in the area on Earth where the shadow lands at a given moment.
The Moon is continuously orbiting around the Earth, so as time goes on during the eclipse, the Moon’s shadow moves over the face of the Earth. Its shadow ends up looking like a thick line that can cover hundreds of miles in length. Astronomers call that line the path of totality.
From any given location along the path of totality, an observer can see the Sun completely eclipsed for a few minutes. Then, the shadow moves away from that location and the Sun slowly becomes more and more visible.
A tilted orbit
Solar eclipses don’t happen every single time the Moon passes in between Earth and the Sun. If that were the case, there would be a solar eclipse every month.
If you could float above the Earth’s North Pole and see the Moon’s orbit from above, you would see the Moon line up with the Sun once every time it orbits around the Earth, which is approximately once per month. From this high point of view, it looks like the Moon’s shadow should land on Earth every orbit.
However, if you could shift your perspective to look at the Moon’s orbit from the orbital plane, you would see that the Moon’s orbit is tilted by about 5 degrees compared with Earth’s orbit around the Sun. This tilt means that sometimes the Moon is too high and its shadow passes above the Earth, and sometimes the Moon is too low and its shadow passes below the Earth. An eclipse happens only when the Moon is positioned just right and its shadow lands on the Earth.
There isn’t an eclipse every time the Moon passes in front of the Sun because of the Moon’s tilted orbit around Earth.
As time goes on, the Earth and the Moon continue spinning, and eventually the Moon aligns with Earth’s orbit around the Sun at the same moment the Moon passes between the Sun and the Earth.
While only certain cities are in the path of totality for this April’s eclipse, the entire U.S. is still close enough to this path that observers outside of the path of totality will see a partial eclipse. In those locations, the Moon will appear to pass in front of part of the Sun, leaving a crescent shape of the Sun still visible at the moment of maximum eclipse.
Climate change complicates plant choices and care. Early flowering and late freezes can kill flowers like these magnolia blossoms. Matt Kasson, CC BY-ND
With the arrival of spring in North America, many people are gravitating to the gardening and landscaping section of home improvement stores, where displays are overstocked with eye-catching seed packs and benches are filled with potted annuals and perennials.
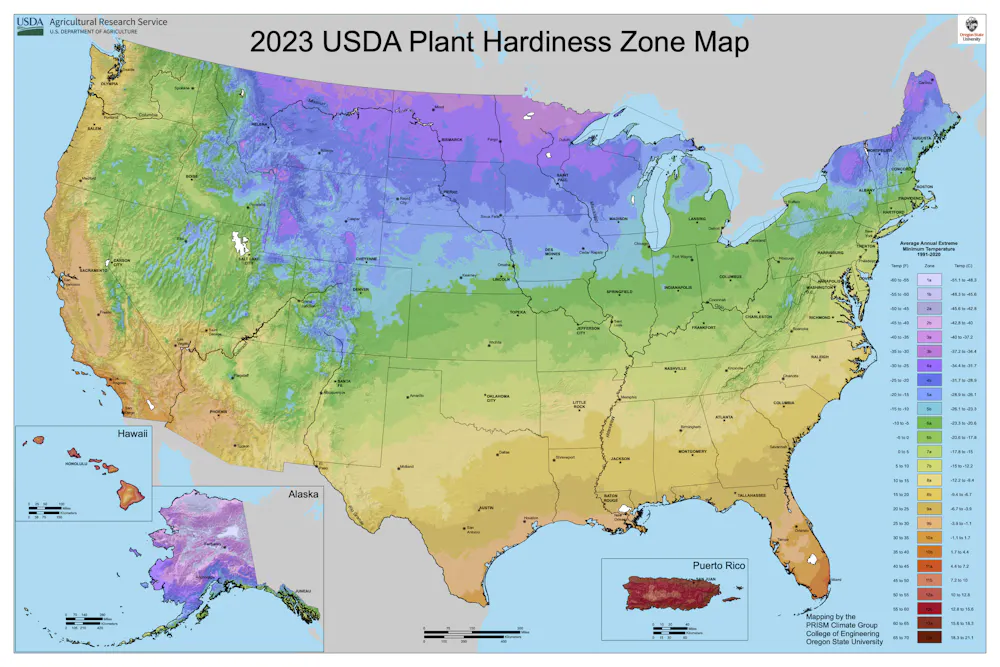
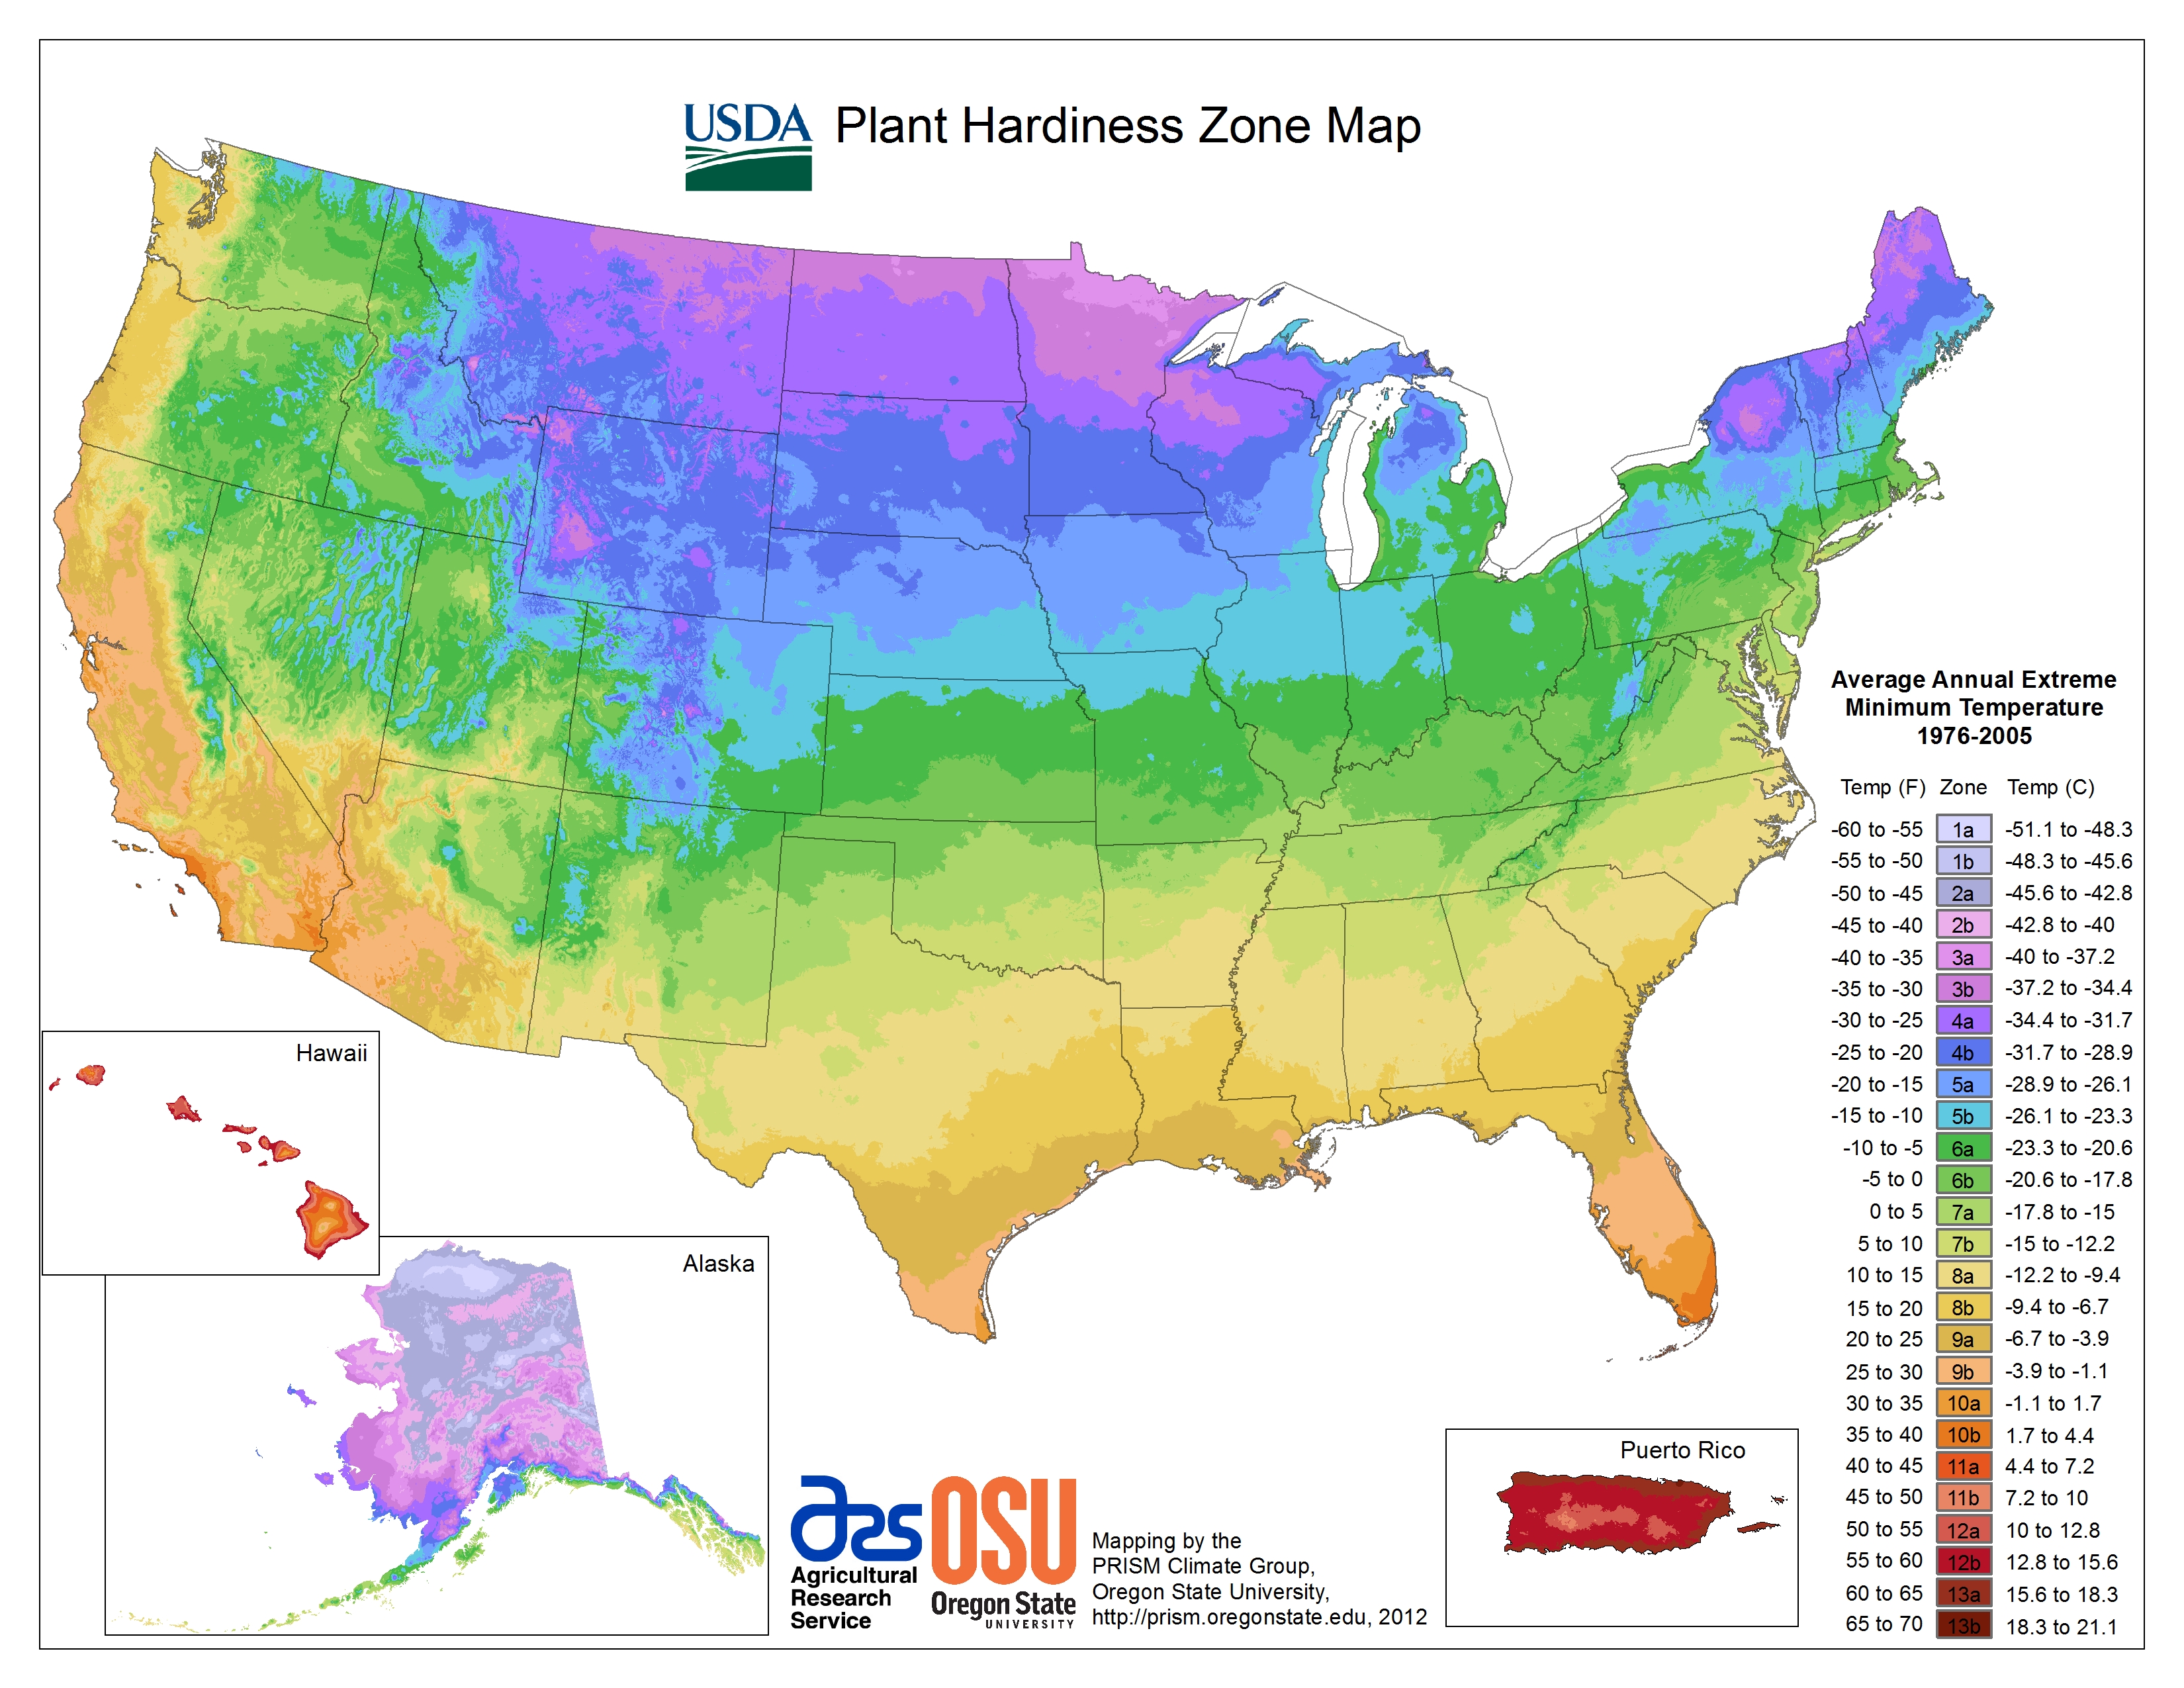
But some plants that once thrived in your yard may not flourish there now. To understand why, look to the U.S. Department of Agriculture’s recent update of its plant hardiness zone map, which has long helped gardeners and growers figure out which plants are most likely to thrive in a given location.
The 2023 USDA plant hardiness zone map shows the areas where plants can be expected to grow, based on extreme winter temperatures. Darker shades (purple to blue) denote colder zones, phasing southward into temperate (green) and warm zones (yellow and orange).USDA
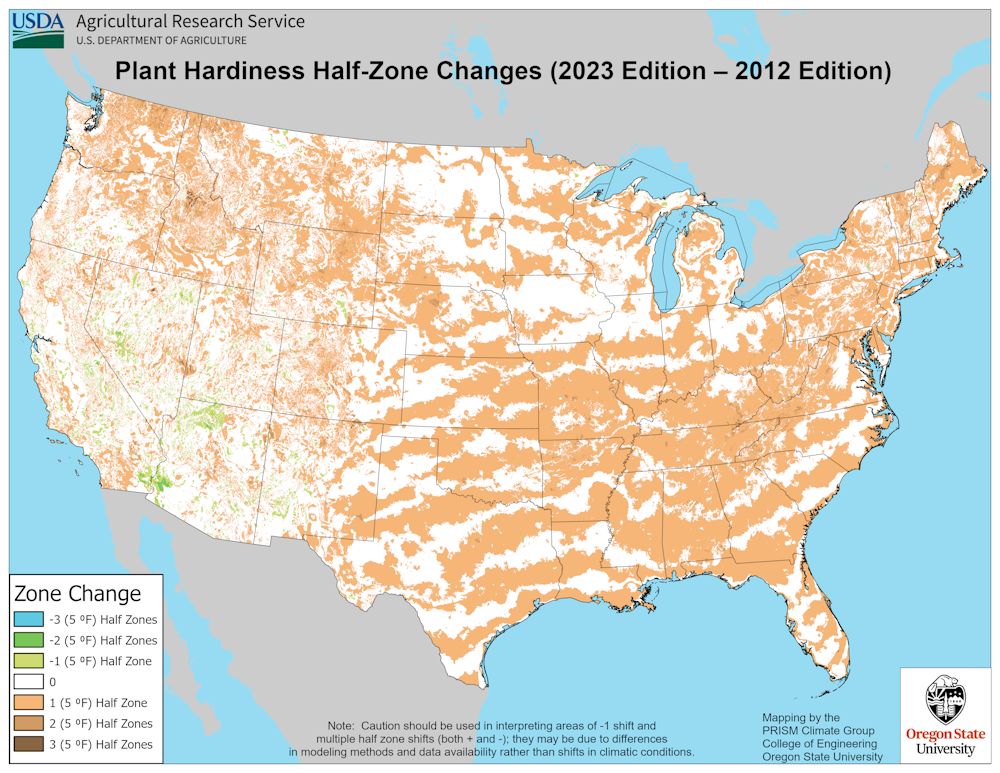
Comparing the 2023 map to the previous version from 2012 clearly shows that as climate change warms the Earth, plant hardiness zones are shifting northward. On average, the coldest days of winter in our current climate, based on temperature records from 1991 through 2020, are 5 degrees Fahrenheit (2.8 Celsius) warmer than they were between 1976 and 2005.
In some areas, including the central Appalachians, northern New England and north central Idaho, winter temperatures have warmed by 1.5 hardiness zones – 15 degrees F (8.3 C) – over the same 30-year window. This warming changes the zones in which plants, whether annual or perennial, will ultimately succeed in a climate on the move.
This map shows how plant hardiness zones have shifted northward from the 2012 to the 2023 USDA maps. A half-zone change corresponds to a tan area. Areas in white indicate zones that experienced minimal change.Prism Climate Group, Oregon State University, CC BY-ND
As a plant pathologist, I have devoted my career to understanding and addressing plant health issues. Many stresses not only shorten the lives of plants, but also affect their growth and productivity.
I am also a gardener who has seen firsthand how warming temperatures, pests and disease affect my annual harvest. By understanding climate change impacts on plant communities, you can help your garden reach its full potential in a warming world.
Hotter summers, warmer winters
There’s no question that the temperature trend is upward. From 2014 through 2023, the world experienced the 10 hottest summers ever recorded in 174 years of climate data. Just a few months of sweltering, unrelenting heat can significantly affect plant health, especially cool-season garden crops like broccoli, carrots, radishes and kale.
Radishes are cool-season garden crops that cannot withstand the hottest days of summer.Matt Kasson, CC BY-ND
Winters are also warming, and this matters for plants. The USDA defines plant hardiness zones based on the coldest average annual temperature in winter at a given location. Each zone represents a 10-degree F range, with zones numbered from 1 (coldest) to 13 (warmest). Zones are divided into 5-degree F half zones, which are lettered “a” (northern) or “b” (southern).
For example, the coldest hardiness zone in the lower 48 states on the new map, 3a, covers small pockets in the northernmost parts of Minnesota and has winter extreme temperatures of -40 F to -35 F. The warmest zone, 11b, is in Key West, Florida, where the coldest annual lows range from 45 F to 50 F.
On the 2012 map, northern Minnesota had a much more extensive and continuous zone 3a. North Dakota also had areas designated in this same zone, but those regions now have shifted completely into Canada. Zone 10b once covered the southern tip of mainland Florida, including Miami and Fort Lauderdale, but has now been pushed northward by a rapidly encroaching zone 11a.
Many people buy seeds or seedlings without thinking about hardiness zones, planting dates or disease risks. But when plants have to contend with temperature shifts, heat stress and disease, they will eventually struggle to survive in areas where they once thrived.
Successful gardening is still possible, though. Here are some things to consider before you plant:
Annuals versus perennials
Hardiness zones matter far less for annual plants, which germinate, flower and die in a single growing season, than for perennial plants that last for several years. Annuals typically avoid the lethal winter temperatures that define plant hardiness zones.
In fact, most annual seed packs don’t even list the plants’ hardiness zones. Instead, they provide sowing date guidelines by geographic region. It’s still important to follow those dates, which help ensure that frost-tender crops are not planted too early and that cool-season crops are not harvested too late in the year.
California poppies are typically grown as annuals in cool areas, but can survive for several years in hardiness zones 8-10.The Marmot/Flickr, CC BY
User-friendly perennials have broad hardiness zones
Many perennials can grow across wide temperature ranges. For example, hardy fig and hardy kiwifruit grow well in zones 4-8, an area that includes most of the Northeast, Midwest and Plains states. Raspberries are hardy in zones 3-9, and blackberries are hardy in zones 5-9. This eliminates a lot of guesswork for most gardeners, since a majority of U.S. states are dominated by two or more of these zones.
Nevertheless, it’s important to pay attention to plant tags to avoid selecting a variety or cultivar with a restricted hardiness zone over another with greater flexibility. Also, pay attention to instructions about proper sun exposure and planting dates after the last frost in your area.
Fruit trees are sensitive to temperature fluctuations
Fruit trees have two parts, the rootstock and the scion wood, that are grafted together to form a single tree. Rootstocks, which consist mainly of a root system, determine the tree’s size, timing of flowering and tolerance of soil-dwelling pests and pathogens. Scion wood, which supports the flowers and fruit, determines the fruit variety.
Most commercially available fruit trees can tolerate a wide range of hardiness zones. However, stone fruits like peaches, plums and cherries are more sensitive to temperature fluctuations within those zones – particularly abrupt swings in winter temperatures that create unpredictable freeze-thaw events.
Following planting instructions carefully can maximize plants’ chances of success.Matt Kasson, CC BY-ND
These seesaw weather episodes affect all types of fruit trees, but stone fruits appear to be more susceptible, possibly because they flower earlier in spring, have fewer hardy rootstock options, or have bark characteristics that make them more vulnerable to winter injury.
Perennial plants’ hardiness increases through the seasons in a process called hardening off, which conditions them for harsher temperatures, moisture loss in sun and wind, and full sun exposure. But a too-sudden autumn temperature drop can cause plants to die back in winter, an event known as winter kill. Similarly, a sudden spring temperature spike can lead to premature flowering and subsequent frost kill.
Pests are moving north too
Plants aren’t the only organisms constrained by temperature. With milder winters, southern insect pests and plant pathogens are expanding their ranges northward.
One example is Southern blight, a stem and root rot disease that affects 500 plant species and is caused by a fungus, Agroathelia rolfsii. It’s often thought of as affecting hot Southern gardens, but has become more commonplace recently in the Northeast U.S. on tomatoes, pumpkins and squash, and other crops, including apples in Pennsylvania.
Southern blight (small round fungal structures) at the base of a tomato plant.Purdue University, CC BY-ND
Other plant pathogens may take advantage of milder winter temperatures, which leads to prolonged saturation of soils instead of freezing. Both plants and microbes are less active when soil is frozen, but in wet soil, microbes have an opportunity to colonize dormant perennial plant roots, leading to more disease.
It can be challenging to accept that climate change is stressing some of your garden favorites, but there are thousands of varieties of plants to suit both your interests and your hardiness zone. Growing plants is an opportunity to admire their flexibility and the features that enable many of them to thrive in a world of change.
California State Parks Off-Highway Motor Vehicle Recreation Division and its partners are encouraging off-highway vehicle enthusiasts to “Share the Trails,” the theme for the upcoming Spring OHV Safety Week, taking place from March 23 to 31.
This semiannual event promotes safe and responsible off-highway vehicle, or OHV, recreation across California's dedicated OHV public lands.
This year’s theme reminds OHV recreational users to focus on sharing the responsibility of following safety protocols and protecting the state’s natural resources.
“It’s important that everyone in the OHV community understands that they share the responsibility for safety,” said Off-Highway Motor Vehicle Recreation Division, or OHMVR, Division Chief Callan McLaughlin. “We share our trails with many types of off-road vehicles and people of different skill levels, so everyone has the opportunity to enjoy our public lands.”
The Spring OHV Safety Week provides an excellent opportunity for all riders, both experienced and newcomers, to enhance their knowledge, skills, and awareness of safe OHV practices by taking safety courses and following simple rules. Training teaches everyone to “Share the Trails” by:
• Staying to the right: Practice proper trail etiquette by always staying to the right side of any trail. • Show yourself: Use a whip and flag at least 8 feet from the ground and wear high-visibility clothing. • Share your skills: Take a free safety class, which can help you become a more experienced rider, then share what you’ve learned with others.
During this year’s OHV Safety Week, several state vehicular recreation areas, or SVRAs, will host free safety training classes for OHV riders.
In October 2020, the California OHMVR Commission passed a resolution dedicating two weeks of the year to promote and focus on safe and responsible OHV practices.
Working together with the Tread Lightly! Initiative, California Highway Patrol, California Outdoor Recreation Foundation, Specialty Vehicle Institute of America, ATV Safety Institute (ASI), Recreational Off-Highway Vehicle Association (ROHVA), Motorcycle Industry Council, Motorcycle Safety Foundation (MSF), and Bureau of Land Management, the OHMVR Division has been providing a mix of safety messages and activities during the OHV safety awareness weeks, using park interpretive programs, in-person events, and safety messaging via various social media platforms. Additionally, ASI, ROHVA, and MSF have teamed up with the division to provide free dirt bike, all-terrain vehicle, and recreational OHV training.
California’s OHMVR Program was created in 1971 out of the critical need to better manage the growing demands for OHV recreation, while fostering respect for private property rights and protecting the state’s natural and cultural resources.
Today, there are nine SVRAs across California: Carnegie SVRA, Clay Pit SVRA, Eastern Kern County Onyx Ranch SVRA, Heber Dunes SVRA, Hollister Hills SVRA, Hungry Valley SVRA, Oceano Dunes SVRA, Ocotillo Wells SVRA and Prairie City SVRA.
These public lands provide recreational opportunities on approximately 145,000 acres of lands with more than 600 miles of designated OHV trails and terrain. Some SVRAs also feature camping, swimming, and other recreational opportunities. A variety of wildlife, sensitive habitats, plants, and animal species call them home.
The OHMVR program also supports safe and responsible OHV recreation beyond the State Park System. Since 1971, more than $803 million in grants, managed by the OHMVR Division, have been awarded to federal and local partners, funding acquisition and development, resource protection, safety and education, and law enforcement for OHV recreation.
For more information about the OHMVR Division, including grant opportunities, please visit https://ohv.parks.ca.gov/.
LAKE COUNTY, Calif. — The National Weather Services says an incoming cold front is expected to bring rain, high winds and cooler temperatures to Lake County and the rest of the North Coast.
The forecast calls for the main impacts to occur on Friday and Saturday, however, there are chances of rain until late next week.
The Lake County forecast anticipates close to an inch of rain on Friday and another half-inch on Saturday.
The rain will be coupled with high winds. Gusts topping 20 miles per hour are expected both days.
Forecasters said snow levels will remain above the 5,000-foot elevation mark on Friday, but could fall to lower levels on Saturday.
At the same time, the Sierras are forecast to get snow and a winter storm warning and winter weather advisory have been issued for eastern California.
After several days of warm and sunny weather, Lake County’s temperatures are expected to be in the low 50s during the day and low 40s at night into early next week, with nighttime temperatures set to drop into the 30s the middle of next week.
Email Elizabeth Larson at This email address is being protected from spambots. You need JavaScript enabled to view it.. Follow her on Twitter, @ERLarson, or Lake County News, @LakeCoNews.
Commercial devices like this are available to calculate the heat index, that is, how hot it actually feels given the humidity. But the algorithm used to compute the heat index breaks down under extreme conditions of temperature and humidity, underestimating the stress on the human body. Photo credit: Yi-Chuan Lu, UC Berkeley. BERKELEY, Calif. — Texans have long endured scorching summer temperatures, so a global warming increase of about 3 degrees Fahrenheit (1.5 Celsius) might not sound like much to worry about.
But a new study concludes that the heat index — essentially how hot it really feels — has increased much faster in Texas than has the measured temperature: about three times faster.
That means that on some extreme days, what the temperature feels like is between 8 and 11 F (5 to 6 C) hotter than it would without climate change.
The study, using Texas data from June, July and August of 2023, highlights a problem with communicating the dangers of rising temperatures to the public. The temperature alone does not accurately reflect the heat stress people feel.
Even the heat index itself, which takes into account the relative humidity and thus the capacity to cool off by sweating, gives a conservative estimate of heat stress, according to study author David Romps, a professor of earth and planetary science at the University of California, Berkeley.
In 2022, Romps co-authored a paper pointing out that the way most government agencies calculate the heat index is inaccurate when dealing with the temperature and humidity extremes we're seeing today. This leads people to underestimate their chances of suffering hyperthermia on the hottest days and of their chances of dying.
Texas is not an outlier. Recently, Arizona's most populous county, covering most of Phoenix, reported that heat-associated deaths last year were 50% higher than in 2022, rising from 425 in 2022 to 645 in 2023. Two-thirds of Maricopa County’s heat-related deaths in 2023 were of people 50 years or older, and 71% occurred on days when the National Weather Service had issued an excessive heat warning, according to the Associated Press.
"I mean, the obvious thing to do is to cease additional warming, because this is not going to get better unless we stop burning fossil fuels," Romps said. "That's message No. 1, without doubt. We have only one direction we can really be taking the planet's average temperature, and that's up. And that's through additional burning of fossil fuels. So that's gotta stop and stop fast."
The reason that it feels much hotter than you'd expect from the increase in ambient temperature alone is that global warming is affecting the interplay between humidity and temperature, he said. In the past, relative humidity typically dropped when the temperature increased, allowing the body to sweat more and thus feel more comfortable.
But with climate change, the relative humidity remains about constant as the temperature increases, which reduces the effectiveness of sweating to cool the body.
To deal with the irreversible temperature increases we already experience, people need to take precautions to avoid hyperthermia, Romps said. He advised that, for those in extreme heat situations and unable to take advantage of air conditioning, "you can use shade and water as your friends.
"You can coat yourself in water. Get a wet rag, run it under the faucet, get your skin wet and get in front of a fan. As long as you are drinking enough water and you can keep that skin wetted in front of the fan, you're doing a good thing for yourself."
Romps' study was published March 15 in the journal Environmental Research Letters (ERL).
It's the humidity
Romps, an atmospheric physicist, got interested several years ago in how the human body responds to global warming's increased temperatures.
Although the heat index, defined in 1979, is based on the physiological stresses induced by heat and humidity, he noted that the calculations of the heat index did not extend to the extremes of heat and humidity experienced today.
Romps and graduate student and now postdoctoral fellow Yi-Chuan Lu extended the calculation of the heat index to all combinations of temperature and humidity, enabling its use in even the most extreme heat waves, like those that buffeted Texas in the summer of 2023.
Over the decades, the nation's major weather forecaster, the National Oceanic and Atmospheric Administration’s National Weather Service, has dealt with the lack of calculated values for high heat and humidity by extrapolating from the known values. Romps and Lu found, however, that the commonly used extrapolation falls far short when conditions of temperature and humidity are extreme.
Although the heat index has now been calculated for all conditions using the underlying physiological model, those values have not yet been adopted by the National Oceanic and Atmospheric Administration, or NOAA.
After Lu spent a sweltering summer in Texas last year, Romps decided to take the state as a case study to determine how global warming has affected the perceived heat stress represented by the corrected heat index.
“I picked Texas because I had seen some high heat index values there that made me think, OK, this is a state that this summer is probably experiencing combinations of heat and humidity that are not being captured properly by NOAA’s approximation to the heat index,” he said.
He found that, while temperatures peaked at various places and times around the state last summer, one place, Houston’s Ellington Airport, stood out. On July 23, 2023, he calculated that the heat index was 75 C, or 167 F. Global warming accounted for 12 F (6 C) of that heat index, he said.
“It sounds completely insane,” Romps said. “It’s beyond the physiological capacity of a young, healthy person to maintain a standard core temperature. We think it’s hyperthermic, but survivable.”
The fact that people can survive such temperatures is a testament to the power of evaporative cooling to cool the body, though intense sweating requires the heart to pump more blood to the skin to shed heat, which is part of heat stress.
In a 2023 paper, Romps and Lu argued that what many have referred to as the maximum survivable temperature, a wet bulb temperature of 35 C (equivalent to a skin temperature when sweating of 95 F, close to the average person’s core body temperature), would actually rarely lead to death in a young and healthy adult, though it would cause hyperthermia.
The wet bulb temperature is what a thermometer measures when a wet rag is wrapped around it, so it takes account of the cooling effects of sweat.
"Heat index is very much like the wet bulb thermometer, only it adds the metabolic heat that a human has that a thermometer does not have," Romps said. "We think if you kept your skin wet and you were exposed to 167 degrees, even though we're approaching something like a setting on the oven, you'd still be alive. Definitely not happy. But alive."
While the current study didn't try to predict when, in the future, heat waves in Texas might generate a heat index high enough to make everyone hyperthermic, "we can see that there are times when people are getting pushed in that direction," he said. "It's not terribly far off."
Romps plans to look at other regions in light of the improved heat index scale he and Lu have proposed and expects to find similar trends.
"If humanity goes ahead and burns the fossil fuel available to it, then it is conceivable that half of Earth's population would be exposed to unavoidably hyperthermic conditions, even for young, healthy adults," Romps said. "People who aren't young and healthy would be suffering even more, as would people who are laboring or are out in the sun — all of them would be suffering potentially life-threatening levels of heat stress."
Robert Sanders writes for the UC Berkeley News Center.
The Department of Water Resources on Friday announced a second increase in the State Water Project, or SWP, allocation forecast for 2024.
The forecasted allocation is now 30 percent of requested supplies, up from the 15 percent allocation update announced last month.
The State Water Project is a critical water source for 29 public water agencies that serve 27 million Californians.
The revised allocation forecast is based on snow survey measurements and data up until March 1 and spring runoff forecasts outlined in the latest Bulletin 120, which was released on March 8.
The next possible allocation update would come after the next round of snow surveys around April 1. Currently, the statewide snowpack is 98 percent of average for this date.
The State Water Project has been focused on maximizing the capture and storage of water from this winter’s storms.
Storage has increased by 630,000 acre-feet at Lake Oroville and by 150,000 acre-feet at San Luis Reservoir since Jan. 1.
The ability to move water south through the system has been significantly impacted by the presence of threatened and endangered fish species near the State Water Project pumping facility in the south Delta.
The presence of these fish species has triggered requirements within the State and federal permits for the operation of the State Water Project and the federal Central Valley Project that have significantly reduced pumping from the Delta.
This reduction in pumping has limited the ability to move water into San Luis Reservoir.
“DWR continues to take proactive measures and use the best available science to operate our water storage and delivery system to balance water supply needs while protecting native fish species,” said DWR Director Karla Nemeth. “As we experience more extreme weather conditions, each year brings its own challenges and that’s why it’s so critical to continue to adapt our water system to build climate resilience.”
“We are pleased to see an increase in the allocation of SWP supplies for public water agencies and combined additional storage of 780,000 acre-feet at Lake Oroville and San Luis Reservoir. While 30% is certainly better than 15%, SWP agencies continue to pay for 100% of the system’s operation and maintenance regardless of how much water they receive,” said Jennifer Pierre, general manager of the State Water Contractors.
However, Pierre said that had the Delta Conveyance Project — a critical upgrade to California’s water infrastructure relied on by 27 million people, 750,000 acres of farmland and countless businesses — been in place this winter, “we could have moved an additional 730,000 acre-feet of water from Jan. 1 to March 14 while keeping endangered species like steelhead safe.”
Pierre added, “California’s climate is rapidly changing, and we must modernize our infrastructure so we can respond quickly to take advantage of unpredictable, flashy storm events and store as much water as possible for the next inevitable dry period. With rain and snow in this weekend’s forecast, we hope to see an increase in the April allocation update.”
DWR’s efforts to adapt to a changing climate include the advancement of the Delta Conveyance Project, which would construct new infrastructure that will make it possible to move more water during high flow events while helping fish species like Steelhead trout avoid threats posed by current pumping infrastructure.
Additionally, DWR and its state, federal, and local partners continue to invest in groundwater recharge projects, surface water storage like Sites Reservoir, and the expansion of desalination and stormwater capture.
California’s reservoirs remain in good shape thanks to last year’s strong winter storms. Statewide, reservoirs are at 115 percent of average for this time of year, with Lake Oroville, the State Water Project’s largest reservoir, at 125 percent of average and 86 percent of capacity.
The updated State Water Project allocation forecast announced Friday anticipates delivery of 30 percent of requested supplies to contractors south of the Delta, which accounts for the majority of contractors; 50 percent of requested supplies to contractors north of the Delta; and an anticipated 100 percent allocation to Feather River Settlement Contractors.
Allocations are updated monthly as snowpack, rainfall, and runoff information is assessed, with a final allocation typically determined in May or June following the April snow survey. The next possible allocation update would be in April.
Yihsu Chen, University of California, Santa Cruz and Andrew L. Liu, Purdue University
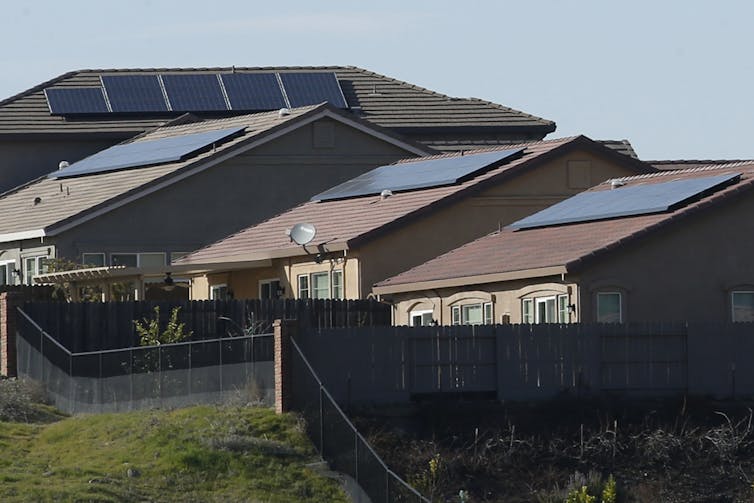
As more homes like these in Folsom, Calif., add solar power, electricity pricing becomes more complicated. AP Photo/Rich Pedroncelli
Small-scale solar power, also known as rooftop or distributed solar, has grown considerably in the U.S. over the past decade. It provides electricity without emitting air pollutants or climate-warming greenhouse gases, and it meets local energy demand without requiring costly investments in transmission and distribution systems.
However, its expansion is making it harder for electric utilities and power grid managers to design fair and efficient retail electricity rates – the prices that households pay.
Under traditional electricity pricing, customers pay one charge per kilowatt-hour of electricity consumption that covers both the energy they use and the fixed costs of maintaining the grid. As more people adopt rooftop solar, they buy less energy from the grid. Fewer customers are left to shoulder utilities’ fixed costs, potentially making power more expensive for everyone.
This trend can drive more customers to leave the system and raise prices further – a scenario known as the utility death spiral. One 2018 study calculated that two-thirds of recent electricity distribution cost increases at California’s three investor-owned utilities were associated with the growth of residential solar.
With abundant sun and solar-friendly policies, California has 36% of U.S. small-scale solar capacity, much more than any other state. And the state is engaged in a heated debate over pricing electricity in ways designed to make energy less expensive for low-income households.
We study energy markets and public policy affecting energy and the environment, and have analyzed various retail electricity rate structures and their economic impacts on power producers and consumers. Our key finding is that an income-based, fixed-charge rate structure of the type that California is currently considering offers the most efficient and equitable solution – if it is designed correctly.
The California Legislature approved fixed-rate electricity charges, based on income, in 2022. Now, state utility regulators are weighing a proposal that would formalize them.
Two-part power bills
The debate over fixed charges began in 2022, when the California Legislature enacted an energy bill that ordered state regulators to study income-based fixed charges and decide whether to adopt them by July 1, 2024. Then the state’s three largest utilities – Southern California Edison, Pacific Gas and Electric, and San Diego Gas & Electric – submitted a proposal to the state Public Utilities Commission in mid-2023 that would separate retail bills into two parts: a fixed charge and a variable charge.
The fixed charge would be a preset monthly fee, independent of energy usage but tied to income levels, so wealthier customers would pay a larger share of grid maintenance costs. The variable charge would be based on the amount of electricity consumed and would cover the actual costs of electricity production and delivery.
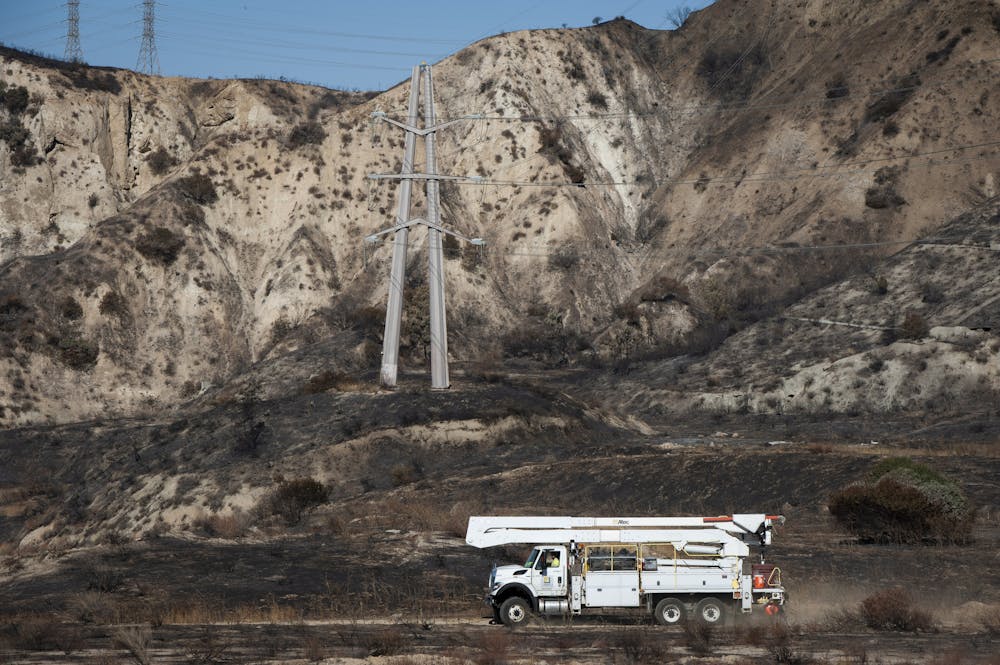
A Southern California Edison truck at a transformer tower in Sylmar, Calif., suspected of starting the 2019 Saddleridge Fire. The utility is burying 10,000 miles of power lines in an effort to prevent its fraying grid from sparking wildfires.AP Photo/Christian Monterrosa
Who benefits?
A two-part billing system that separates fixed costs from variable usage charges offers potential benefits for both consumers and utilities.
For utilities, the fixed charge offers a stable revenue stream. The companies know how many households they serve, and they can plan on the fixed amounts that those households will pay each month. Households that go solar would still pay the fixed charge, since most of them draw electricity from the grid when the sun doesn’t shine.
This approach provides financial stability for the utility and access to the grid for all. Consumers would benefit because with a certain amount of income guaranteed, utilities could charge significantly less per kilowatt-hour for the actual electricity that households use.
One significant concern is that if electricity costs less, people may use more of it, which could undermine efforts toward energy conservation and lead to an increase in emissions. In our view, the way to address this risk is by fine-tuning the two-part billing structure so that it covers only a portion of the utilities’ costs through fixed charges and incorporates the rest into the variable usage rates.
Put another way, combining a lower fixed charge with a higher variable charge would ensure that utilities can still cover their fixed costs effectively, while encouraging mindful energy use among consumers. Ensuring affordable electricity for consumers, fair cost recovery for utilities and overall fairness and efficiency in the energy market requires striking a delicate balance.
Another argument from critics, often labeled “energy socialism,” asserts that higher-income households might end up subsidizing excessive electricity use by lower-income households under the income-based rate structure. In our view, this perception is inaccurate.
Wealthy households would pay more to maintain the grid, via larger fixed charges, than poorer households, but would not subsidize lower-income households’ energy use. All income groups would pay the same rate for each additional kilowatt-hour of electricity that they use. Decisions on energy use would remain economically driven, regardless of consumers’ income level.
Fixed fees are too big
While our research supports California utilities’ approach in principle, we believe their proposal has shortcomings – notably in the proposed income brackets.
As currently framed, households with annual incomes between US$28,000 and $69,000 would pay a fixed fee of $20 to $34 per month. Households earning between $69,000 and $180,000 would pay $51 to $73 per month, and those earning more than $180,000 would pay $85 to $128.
The middle-income bracket starts just above California’s median household income. Consequently, nearly half of all California households could find themselves paying a substantial monthly fee – $51 to $73 – regardless of their actual electricity usage.
It could be hard to convince consumers to pay significant fixed fees for intangible services, especially middle-income residents who have either gone solar or may do so. Not surprisingly, the proposal has encountered considerable pushback from the solar industry.
Finding the sweet spot
In response to public outcry, California lawmakers recently introduced Assembly Bill 1999, which would replace the income-graduated fixed-charge requirement with fixed charges of $5 per month for low-income customers and up to $10 per month for others. In our view, this reaction goes too far in the other direction.
Capping fixed charges at such low levels would force utilities to hike their energy use rates to cover fixed costs – again, risking the death spiral scenario. Our research indicates that there is a range for the fixed charge that would cover a reasonable share of utilities’ fixed costs, but is not high enough to burden consumers.
Without utility cost data, we can’t pinpoint this range precisely. However, based on estimates of utilities’ costs, we believe the caps proposed in AB 1999 are too low and could end up unfairly burdening those the bill aims to protect.
In our research, based on a hypothetical case study, we found a sweet spot in which fixed charges cover about 40% of utilities’ fixed costs. Charges at this level provide maximum benefit to consumers, although they reduce energy producers’ profits.
Our findings are similar to an alternative proposal jointly presented by The Utility Reform Network, a nonprofit consumer advocacy organization, and the Natural Resources Defense Council, an environmental advocacy group. This plan suggests a two-part rate structure with an average fixed charge of about $36 per month. Low-income households would pay $5 per month, and those earning over $150,000 yearly would pay about $62.
We believe this proposal moves in the right direction by ensuring fair contributions to grid costs, while also encouraging efficient energy use and investment in clean energy infrastructure. It could act as a guide for other U.S. states searching for methods to balance utility fixed-cost recovery with fair pricing and continued growth of small-scale solar power.
The Soyuz rocket launches to the International Space Station with Expedition 71 NASA astronaut Tracy Dyson, Roscosmos cosmonaut Oleg Novitskiy, and Belarus spaceflight participant Marina Vasilevskaya, onboard, Saturday, March 23, 2024, at the Baikonur Cosmodrome in Kazakhstan. Photo by NASA/Bill Ingalls. Three crew members including NASA astronaut Tracy C. Dyson successfully launched at 8:36 a.m. EDT Saturday from the Baikonur Cosmodrome in Kazakhstan to the International Space Station.
Dyson, along with her crewmates Roscosmos cosmonaut Oleg Novitskiy and spaceflight participant Marina Vasilevskaya of Belarus, will dock to the space station’s Prichal module about 11:09 a.m. on Monday, March 25, on the Soyuz MS-25 spacecraft.
Docking coverage will begin at 10:15 a.m. on NASA+, NASA Television, the NASA app, YouTube, and the agency’s website. NASA also will air coverage, starting at 1:15 p.m., of the crew welcome ceremony on NASA+ once they are aboard the orbital outpost. Learn how to stream NASA TV through a variety of platforms including social media.
When the hatches between the station and the Soyuz open about 1:40 p.m., the new crew members will join NASA astronauts Loral O’Hara, Matthew Dominick, Mike Barratt, and Jeanette Epps, as well as Roscosmos cosmonauts Oleg Kononenko, Nikolai Chub, and Alexander Grebenkin, already living and working aboard the space station.
Novitskiy and Vasilevskaya will be aboard the station for 12 days, before providing the ride home for O’Hara on Saturday, April 6, aboard Soyuz MS-24 for a parachute-assisted landing on steppe of Kazakhstan.
Dyson will spend six months aboard the station as an Expedition 70 and 71 flight engineer, returning to Earth in September with Oleg Kononenko and Nikolai Chub of Roscosmos, who will complete a year-long mission on the laboratory.
This will be the third spaceflight for Dyson, the fourth for Novitskiy, and the first for Vasilevskaya.
Dennis Fordham. Courtesy photo. Some adult children live with their parents. Perhaps they returned home after a divorce, the loss of a job, due to a disability, and perhaps they never left.
Often the parents provide free rent and utilities and even food and money to cover transportation and insurance. The children may take care of household chores.
What happens when the parents are incapacitated or die? Let us presume the parents have a living trust and durable powers of attorney to manage their assets.
If the parents become incapacitated but remain at home, the trust may expressly allow the children to live rent free as before. This presumes that the parents’ estate can afford to cover the expenses, including the additional expenses due to parents’ incapacity.
The dependent children may need to pay some or all the household expenses. Also, it may be necessary either to sell the house or to borrow against the equity. The trust should address these issues.
Typically, the parents’ trust says what happens if the incapacitated parents are no longer living at home because they live permanently at an assisted living or skilled nursing facility. Is the residence sold or maintained for the benefit of the dependent children? The possibilities vary with the circumstances. If the residence is sold, the trust may give the children time to relocate, and maybe, some cash to avoid problems and disagreements.
How are the sale proceeds used? Will the trust also assist the dependent children or must they wait till the parents die. Ultimately, when the parents die their trust will say how the estate is divided amongst the children, whether inheritances are distributed outright, are held in further trust, or used otherwise.
No one size fits all. Some parents feel that they need to leave more money to take care of dependent adult children who are unable to provide for themselves, especially disabled adult children. A special needs trust may be in order.
Sometimes the family home remains in trust to assist the children. The trust should say how the real property taxes, insurance, repairs, maintenance, and utilities are to be paid. Perhaps the parents may leave assets to pay some or all of such expenses.
The children may need to pay some or all these expenses, sooner or later. If the household related expenses cannot be paid the residence will have to be sold and the proceeds divided amongst the children, either equally or unequally, and again, either distributed outright or in further trust.
Holding assets in further trust may be necessary to protect children due to their inability to properly manage assets, due to their unpaid debts (creditor problems), due to predators, or due to the fact that they receive needs-based government benefits that may be lost unless the inheritance is placed into a special needs trust, as relevant.
Finally, parents with disabled children are often concerned about what happens to their dependent children after the parents die. Estate planning offers parents an opportunity to avoid unintended consequences and lessen the severity of what their dependent children will experience. It also gives the parents some peace of mind knowing that they have their affairs in order.
The foregoing discussion is not legal advice. Consult a qualified attorney for guidance.
Dennis A. Fordham, attorney, is a State Bar-Certified Specialist in estate planning, probate and trust law. His office is at 870 S. Main St., Lakeport, Calif. He can be reached at This email address is being protected from spambots. You need JavaScript enabled to view it. and 707-263-3235.
CLEARLAKE, Calif. — Clearlake Animal Control has dozens of adoptable dogs waiting for new families.
The Clearlake Animal Control website lists 51 adoptable dogs.
"Layla." Photo courtesy of Clearlake Animal Control. This week’s dogs include “Layla,” a female American Staffordshire terrier mix with a black and white coat.
Also up for adoptin is “Chandler,” a 6-month-old male American pit bull terrier mix with a white and fawn coat.
"Chandler." Photo courtesy of Clearlake Animal Control. The shelter is located at 6820 Old Highway 53. It’s open from 9 a.m. to 6 p.m. Tuesday through Saturday.
For more information, call the shelter at 707-762-6227, email This email address is being protected from spambots. You need JavaScript enabled to view it., visit Clearlake Animal Control on Facebook or on the city’s website.
This week’s adoptable dogs are featured below.
Email Elizabeth Larson at This email address is being protected from spambots. You need JavaScript enabled to view it.. Follow her on Twitter, @ERLarson, or Lake County News, @LakeCoNews.

 How to resolve AdBlock issue?


