 How to resolve AdBlock issue?
 - JOHN CREAMER
- Posted On
Census data shows inequalities persist despite decline in poverty for all major race and Hispanic origin groups
Poverty rates declined between 2018 and 2019 for all major race and Hispanic origin groups.
Two of these groups, Blacks and Hispanics, reached historic lows in their poverty rates in 2019. The poverty rate for Blacks was 18.8 percent; for Hispanics, it was 15.7 percent.
The historically low poverty rates for Blacks and Hispanics in 2019 reflect gains for race and Hispanic origin groups that have traditionally been disadvantaged compared to other groups over time.
These estimates, released today, are from the Current Population Survey Annual Social and Economic Supplement, or CPS ASEC.
Changes in surveys over time can make historical comparisons difficult. Using a methodology proposed last year, we can adjust the historical series to account for statistically significant impacts of recent CPS ASEC survey redesigns.
The figure below charts historical poverty rates for each of the major race and Hispanic origin groups and Hispanics in the CPS ASEC.
Adjustments are made for Asians, Blacks and non-Hispanic Whites because the recent survey changes resulted in statistically significant changes in poverty rates. Poverty rates for Hispanics are not adjusted because the survey changes did not result in statistically different poverty rates.

The figure shows that for Blacks, the poverty rate of 18.8 percent in 2019 was the lowest rate observed since poverty estimates were first produced for this group for 1959. The previous low for this group was 20.8 percent in 2018.
Poverty rates in 2019 were also the lowest ever observed for Hispanics (15.7 percent), compared to the prior low of 17.6 percent in 2018. Poverty statistics for Hispanics date back to 1972.
The Asian poverty rate of 7.3 percent was also the lowest on record.
The 2019 poverty rate of 7.3 percent for non-Hispanic Whites was not statistically different than the previous low (historically adjusted) of 7.2 percent in 2000 and 7.3 percent in 1973.
Distribution of poverty by race and Hispanic origin
The historically low poverty rates for Blacks and Hispanics in 2019 reflect gains for race and Hispanic origin groups that have traditionally been disadvantaged compared to other groups over time.
However, even with these gains, Blacks and Hispanics continue to be over-represented in the population in poverty relative to their representation in the overall population.
The figure below shows the ratio of people in poverty by race or Hispanic origin group to each group’s share of the total population.
If the poverty population is perfectly proportional to the total population, we would expect the ratio to be 1.0. If a group is over-represented in poverty, the ratio will be greater than 1.0. If the ratio is less than 1.0, the group is under-represented in poverty.

In 2019, the share of Blacks in poverty was 1.8 times greater than their share among the general population. Blacks represented 13.2 percent of the total population in the United States, but 23.8 percent of the poverty population.
The share of Hispanics in poverty was 1.5 times more than their share in the general population. Hispanics comprised 18.7 percent of the total population, but 28.1 percent of the population in poverty.
In contrast, non-Hispanic Whites and Asians were under-represented in the poverty population.
Non-Hispanic Whites made up 59.9 percent of the total population but only 41.6 percent of the population in poverty. Asians made up 6.1 percent of the population and 4.3 percent of the population in poverty.
These disparities are especially pronounced among children and people ages 65 and older.
The share of Non-Hispanic White and Asian children in poverty was about half of their share in the general population. Among people ages 65 and over, the shares of Blacks and Hispanics in poverty were approximately twice their share in the general population.
Time trends
The figure below shows that over time, non-Hispanics Whites have consistently been under-represented among the population in poverty, while Blacks and Hispanics have consistently been over-represented. Asians have been under-represented in poverty for the last 20 years.
The adjustment for survey changes is not made here for simplicity.
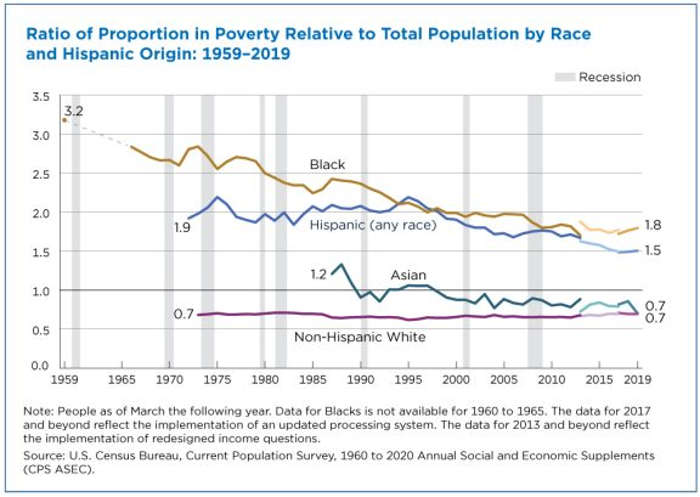
The figure shows that there has been a gradual decrease in the degree of over-representation of Blacks and Hispanics in poverty.
After the Great Recession ended in June 2009, the degree of overrepresentation stayed level for Blacks, while the ratio moved closer to one for Hispanics, continuing a trend which started in the mid-1990s.
One potential reason for the recent trend is that since 2008, median household income for Blacks has grown at a slower rate than median household income for Hispanics.
The figure below tracks median household income using 2019 dollars from 2008, the last full year of the most recent recession, until 2019.
Like Figure 1, the series below implements adjustments to the estimates for groups whose median household incomes were statistically changed by the survey improvements.
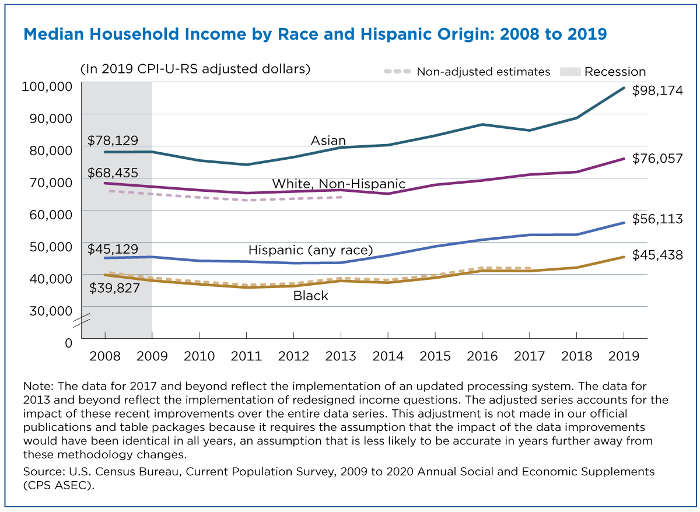
In 2019, median household income for Black households was $45,438 compared to $56,113 for Hispanic households, $76,057 for non-Hispanic White households, and $98,174 for Asian households.
Since 2008, median household income increased 14.1 percent for Black households, compared to 24.3 percent for Hispanic households, 11.1 percent for non-Hispanic White households, and 25.7 percent for Asian households.
For more information on year-to-year poverty changes and household income, see Income and Poverty in the United States: 2019.
John Creamer is an economist in the Census Bureau’s Poverty Statistics Branch.