An artist’s concept of the Lucy spacecraft. Credits: NASA's Goddard Space Flight Center. NASA’s Lucy spacecraft will add another asteroid encounter to its 4-billion-mile journey. On Nov. 1, 2023, Lucy will get a close-up view of a small main-belt asteroid to conduct an engineering test of the spacecraft’s innovative asteroid-tracking navigation system.
The Lucy mission is already breaking records by planning to visit nine asteroids during its 12-year tour of the Jupiter Trojan asteroids, which orbit the Sun at the same distance as Jupiter.
Originally, Lucy was not scheduled to get a close-up view of any asteroids until 2025, when it will fly by the main belt asteroid (52246) Donaldjohanson.
However, the Lucy team identified a small, as-yet unnamed asteroid in the inner main belt, designated (152830) 1999 VD57, as a potential new and useful target for the Lucy spacecraft.
“There are millions of asteroids in the main asteroid belt,” said Raphael Marschall, Lucy collaborator of the Nice Observatory in France, who identified asteroid 1999 VD57 as an object of special interest for Lucy. “I selected 500,000 asteroids with well-defined orbits to see if Lucy might be traveling close enough to get a good look at any of them, even from a distance. This asteroid really stood out. Lucy’s trajectory as originally designed will take it within 40,000 miles of the asteroid, at least three times closer than the next closest asteroid.”
The Lucy team realized that, by adding a small maneuver, the spacecraft would be able to get an even closer look at this asteroid. So, on Jan. 24, the team officially added it to Lucy’s tour as an engineering test of the spacecraft’s pioneering terminal tracking system.
This new system solves a long-standing problem for flyby missions: during a spacecraft’s approach to an asteroid, it is quite difficult to determine exactly how far the spacecraft is from the asteroid, and exactly which way to point the cameras.
“In the past, most flyby missions have accounted for this uncertainty by taking a lot of images of the region where the asteroid might be, meaning low efficiency and lots of images of blank space,” said Hal Levison, Lucy principal investigator from the Southwest Research Institute Boulder, Colorado office. “Lucy will be the first flyby mission to employ this innovative and complex system to automatically track the asteroid during the encounter. This novel system will allow the team to take many more images of the target.”
It turns out that 1999 VD57 provides an excellent opportunity to validate this never-before-flown procedure.
The geometry of this encounter — particularly the angle that the spacecraft approaches the asteroid relative to the Sun — is very similar to the mission’s planned Trojan asteroid encounters.
This allows the team to carry out a dress rehearsal under similar conditions well in advance of the spacecraft’s main scientific targets.
This asteroid was not identified as a target earlier because it is extremely small. In fact, 1999 VD57, estimated to be a mere 0.4 miles (700 m) in size, will be the smallest main belt asteroid ever visited by a spacecraft. It is much more similar in size to the near-Earth asteroids visited by recent NASA missions OSIRIS-REx and DART than to previously visited main belt asteroids.
The Lucy team will carry out a series of maneuvers starting in early May 2023 to place the spacecraft on a trajectory that will pass approximately 280 miles (450 km) from this small asteroid.
Lucy’s principal investigator is based out of the Boulder, Colorado branch of Southwest Research Institute, headquartered in San Antonio, Texas. NASA’s Goddard Space Flight Center in Greenbelt, Maryland, provides overall mission management, systems engineering, and safety and mission assurance. Lockheed Martin Space in Littleton, Colorado, built the spacecraft. Lucy is the 13th mission in NASA’s Discovery Program. NASA’s Marshall Space Flight Center in Huntsville, Alabama, manages the Discovery Program for the Science Mission Directorate at NASA Headquarters in Washington.
Katherine Kretke writes for the Southwest Research Institute in San Antonio, Texas.
As the NASA Lucy spacecraft travels through the inner edge of the main asteroid belt in the Fall of 2023, the spacecraft will fly by the small, as-of-yet unnamed, asteroid (152830) 1999 VD57. This graphic shows a top-down view of the Solar System indicating the spacecraft's trajectory shortly before the Nov. 1, 2022, encounter. Credits: NASA's Goddard Space Flight Center.
The slice you see cut out of the Earth reveals its core, depicted here in bright yellow. fhm/E+ via Getty Images
Curious Kids is a series for children of all ages. If you have a question you’d like an expert to answer, send it to This email address is being protected from spambots. You need JavaScript enabled to view it..
How does the inside of the Earth stay boiling hot for billions of years? Henry, age 11, Somerville, Massachusetts
Our Earth is structured sort of like an onion – it’s one layer after another.
Starting from the top down, there’s the crust, which includes the surface you walk on; then farther down, the mantle, mostly solid rock; then even deeper, the outer core, made of liquid iron; and finally, the inner core, made of solid iron, and with a radius that’s 70% the size of the Moon’s. The deeper you dive, the hotter it gets – parts of the core are as hot as the surface of the Sun.
As a professor of earth and planetary sciences, I study the insides of our world. Just as a doctor can use a technique called sonography to make pictures of the structures inside your body with ultrasound waves, scientists use a similar technique to image the Earth’s internal structures. But instead of ultrasound, geoscientists use seismic waves – sound waves produced by earthquakes.
At the Earth’s surface, you see dirt, sand, grass and pavement, of course. Seismic vibrations reveal what’s below that: rocks, large and small. This is all part of the crust, which may go down as far as 20 miles (30 kilometers); it floats on top of the layer called the mantle.
The upper part of the mantle typically moves together with the crust. Together, they are called the lithosphere, which is about 60 miles (100 kilometers) thick on average, although it can be thicker at some locations.
The lithosphere is divided into several large blocks called plates. For example, the Pacific plate is beneath the whole Pacific Ocean, and the North American plate covers most of North America. Plates are kind of like puzzle pieces that fit roughly together and cover the surface of the Earth.
The plates are not static; instead, they move. Sometimes it’s the tiniest fraction of inches over a period of years. Other times, there’s more movement, and it’s more sudden. This sort of movement is what triggers earthquakes and volcanic eruptions.
What’s more, plate movement is a critical, and probably essential, factor driving the evolution of life on Earth, because the moving plates change the environment and force life to adapt to new conditions.
You’ll be amazed at all the life happening below your feet.
The heat is on
Plate motion requires a hot mantle. And indeed, as you go deeper into the Earth, the temperature increases.
At the bottom of the plates, around 60 miles (100 kilometers) deep, the temperature is about 2,400 degrees Fahrenheit (1,300 degrees Celsius).
By the time you get to the boundary between the mantle and the outer core, which is 1,800 miles (2,900 kilometers) down, the temperature is nearly 5,000 F (2,700 C).
Then, at the boundary between outer and inner cores, the temperature doubles, to nearly 10,800 F (over 6,000 C). That’s the part that’s as hot as the surface of the Sun. At that temperature, virtually everything – metals, diamonds, human beings – vaporizes into gas. But because the core is at such high pressure deep within the planet, the iron it’s made up of remains liquid or solid.
Without plate tectonics, human beings probably would not exist.
Collisions in outer space
Where does all that heat come from?
It is not from the Sun. While it warms us and all the plants and animals on Earth’s surface, sunlight can’t penetrate through miles of the planet’s interior.
Instead, there are two sources. One is the heat that Earth inherited during its formation 4.5 billion years ago. The Earth was made from the solar nebula, a gigantic gaseous cloud, amid endless collisions and mergings between bits of rock and debris called planetesimals. This process took tens of millions of years.
An enormous amount of heat was produced during those collisions, enough to melt the whole Earth. Although some of that heat was lost in space, the rest of it was locked away inside the Earth, where much of it remains even today.
The other heat source: the decay of radioactive isotopes, distributed everywhere in the Earth.
To understand this, first imagine an element as a family with isotopes as its members. Every atom of a given element has the same number of protons, but different isotope cousins have varying numbers of neutrons.
Radioactive isotopes are not stable. They release a steady stream of energy that converts to heat. Potassium-40, thorium-232, uranium-235 and uranium-238 are four of the radioactive isotopes keeping Earth’s interior hot.
Some of those names may sound familiar to you. Uranium-235, for example, is used as a fuel in nuclear power plants. Earth is in no danger of running out of these sources of heat: Although most of the original uranium-235 and potassium-40 are gone, there’s enough thorium-232 and uranium-238 to last for billions more years.
Along with the hot core and mantle, these energy-releasing isotopes provide the heat to drive the motion of the plates.
But without the Earth’s internal heat, the plates would not have been moving. The Earth would have cooled down. Our world would likely have been uninhabitable. You wouldn’t be here.
Think about that, the next time you feel the Earth under your feet.
Hello, curious kids! Do you have a question you’d like an expert to answer? Ask an adult to send your question to This email address is being protected from spambots. You need JavaScript enabled to view it.. Please tell us your name, age and the city where you live.
Andrew Stokes, Boston University; Dielle Lundberg, Boston University; Elizabeth Wrigley-Field, University of Minnesota, and Yea-Hung Chen, University of California, San Francisco
Since the COVID-19 pandemic was declared in March 2020, a recurring topic of debate has been whether official COVID-19 death statistics in the U.S. accurately capture the fatalities associated with SARS-CoV-2, the virus that causes COVID-19.
Some politicians and a few public health practitioners have argued that COVID-19 deaths are overcounted. For instance, a January 2023 opinion piece in The Washington Post claims that COVID-19 death tallies include not only those who died from COVID-19 but those who died from other causes but happened to have COVID-19.
Most scientists, however, have suggested that COVID-19 death tallies represent underestimates because they fail to capture COVID-19 deaths that were misclassified to other causes of death.
We are part of a team of researchers at Boston University, University of Minnesota, University of California San Francisco and other institutions who have been tracking COVID-19 deaths since the beginning of the pandemic. A major goal for our team has been to assess whether the undercounting of COVID-19 deaths has occurred, and if so in which parts of the country.
Examining excess deaths
One way to examine the issue is to look at what population health researchers call excess mortality. It’s a measure which, in this case, compares the number of deaths that occurred during the pandemic to the number of deaths that would have been expected based on pre-pandemic trends.
Excess mortality captures deaths that arose from COVID-19 directly or through indirect pathways such as patients avoiding hospitals during COVID-19 surges. While determining a cause of death can be a complex process, recording whether or not someone died is more straightforward. For this reason, calculations of excess deaths are viewed as the least biased estimate of the pandemic’s death toll.
As a general rule of thumb – with some important caveats that we explain below – if there are more COVID-19 deaths than excess deaths, COVID-19 deaths were likely overestimated. If there are more excess deaths than COVID-19 deaths, COVID-19 deaths were likely underestimated.
In a newly released study that has not yet been peer-reviewed, our team found that during the first two years of the pandemic – from March 2020 to February 2022 – there were between 996,869 and 1,278,540 excess deaths in the U.S. Among these, 866,187 were recognized as COVID-19 on death certificates. This means that there were between 130,682 and 412,353 more excess deaths than COVID-19 deaths. The gap between excess deaths and COVID-19 deaths was large in both the first and second years of the pandemic. This suggests that COVID-19 deaths were undercounted even after the pandemic’s chaotic early months.
A stirring video demonstrating excess deaths from COVID-19 in the first year of the pandemic.
Major studieshave alsoconcluded that excess deaths exceeded COVID-19 deaths at the national level during the first two years of the pandemic. And preliminary analyses by our team have found that the gap between excess deaths and COVID-19 deaths has persisted into the third year of the pandemic. This suggests that COVID-19 deaths are still being undercounted.
Making sense of the discrepancy
Explaining the discrepancy between excess deaths and reported COVID-19 deaths is a more challenging task. But several threads of evidence support the idea that the difference largely reflects uncounted COVID-19 deaths.
In a recent study, we found that excess deaths peaked immediately before spikes in reported COVID-19 deaths. This was the case even for excess deaths associated with causes like Alzheimer’s disease that are unlikely to rapidly change due to patients avoiding hospitals or other changes in behavior during the pandemic.
This finding aligns with the observation that COVID-19 deaths may go unrecognized – and be misclassified to other causes of death – at the beginning of COVID-19 surges. At this time, COVID-19 testing may be less frequent in the community, among medical providers and among death investigators. If excess deaths were not caused by COVID-19, they would instead either remain relatively constant during COVID-19 surges or they would peak afterwards when hospitals were overcrowded and deaths may have resulted from health care interruptions.
Excess deaths related to external causes of death such as drug overdose also increased during the pandemic. However, a preliminary study found that the scale of this increase was small relative to the overall increase in excess deaths. So deaths from external factors alone cannot explain the gap between excess and COVID-19 deaths.
This evidence is worth considering in light of the prominent opinion piece in the Washington Post mentioned earlier, which suggests that the U.S.‘s tally of COVID-19 deaths is a substantial overcount. The author argues that in some hospitals, widespread COVID-19 testing has led patients with COVID-19 who died of other causes to still have COVID-19 included as a cause on their death certificate. There is a fundamental misunderstanding, however, in generalizing these hospital deaths to the entire country.
One reason this overgeneralization is flawed is because hospital deaths are distinct from out-of-hospital deaths. In out-of-hospital settings, COVID-19 testing is often lacking and death investigators have less training and less information about the deceased. In fact, our research suggests that COVID-19 deaths are largely undercounted in out-of-hospital settings.
Investigative reporting among coroners in rural areas has also revealed significant variability in out-of-hospital cause of death assignment. Some coroners have even gone on record to state that they do not include COVID-19 on death records if it contradicts their own political beliefs or if families wish for it to be omitted.
The other problem with the overgeneralization is geographic. Our preliminary study demonstrates that excess deaths exceeded COVID-19 deaths in the vast majority of counties across the U.S. In particular, counties in the South, the Rocky Mountain states and rural areas had many more excess deaths than COVID-19 deaths. This suggests that COVID-19 deaths were likely undercounted in these areas.
The idea that COVID-19 deaths are sometimes overreported is, to a very limited extent, supported by our analyses. A select number of large and medium-sized metro areas in New England and the mid-Atlantic states have had more COVID-19 deaths than excess deaths. But most of the country has not followed the patterns of this small group of counties.
While it is possible that some deaths assigned to COVID-19 in New England and the mid-Atlantic states were not actually caused by COVID-19, other explanations are also possible. First, COVID-19 mitigation efforts could have prevented deaths in these areas via pathways unrelated to COVID-19, reducing excess deaths. For example, some people living in wealthy, urban counties had the privilege to work from home and avoid household crowding, which may have reduced their risk of dying from flu. Flu is typically responsible for as many as 50,000 deaths each year.
In fact, the 2020-2021 flu season was minimal, likely because of social distancing. Another possible explanation is that later in the first two years of the pandemic, there may have also been fewer deaths than expected in some areas because some of the least healthy people in the area had already died of COVID-19. These alternative explanations imply that, even in those New England and mid-Atlantic counties where more COVID-19 deaths were recorded than estimated excess deaths, many COVID-19 deaths may still have occurred even as other kinds of deaths decreased.
Why it matters
Ultimately, figuring out how many people have died as a result of the COVID-19 pandemic is a major scientific undertaking that has significant political importance. Knowing how many people died and where these deaths occurred has widespread implications for informing how current pandemic response resources are allocated and for preparing for future public health emergencies.
As a result, in our view, it is critical that the scientific community carefully reviews the rigor of the science behind the counting of COVID-19 deaths. Given the intense politicization of the pandemic, claims of overcounting or undercounting need to be made cautiously.
Finally, research by our team and investigative reporting conducted in partnership with our team has found that the undercounting of COVID-19 deaths is significantly more common in Black, Hispanic and Native American communities as well as low-income areas. Claims that COVID-19 deaths have been overcounted undermine efforts to reconcile the undercounts in these communities and to ensure resources are being allocated to those most affected. For example, if a person does not have COVID-19 assigned as a cause on their death certificate, their family is ineligible for pandemic social programs such as the FEMA funeral assistance program.
To understand where the U.S. public health system has succeeded and fallen short during the pandemic, a full accounting of deaths caused by COVID-19 is needed. More than that, families, friends and loved ones of those who have died so far also deserve to know the true toll that COVID-19 has taken.
LAKE COUNTY, Calif. — Millions of dollars in new highway work has been approved for Lake County.
On Friday, the California Transportation Commission, or CTC, allocated more than $988 million to repair and improve transportation infrastructure throughout the state.
This funding includes more than $450 million from the federal Infrastructure Investment and Jobs Act of 2021, or IIJA, and more than $250 million from Senate Bill 1, the Road Repair and Accountability Act of 2017.
“The CTC’s investments will help rebuild California’s transportation infrastructure while increasing transit and active transportation options. These projects reflect the CTC and Caltrans’ commitment to safety and meeting future challenges,” said Caltrans Director Tony Tavares.
The CTC approved approximately $20.9 million, including more than $18.7 million in federal IIJA funding toward roadway, guardrail and other improvements from west of Irvine Avenue to east of Mid Lake Road near Upper Lake along Route 20 in Lake County.
In another project that will benefit Lake County, approximately $3.1 million was allocated toward the removal of hazardous trees on U.S. 101, and Routes 1 and 175 at various locations in Mendocino and Lake counties.
Other projects in the region the CTC approved on Friday include:
• Approximately $7.2 million including more than $6.3 million in federal IIJA funding toward the construction of an auxiliary lane on U.S. 101 from Route 299 to south of Giuntoli Lane in Arcata, Humboldt County.
• Approximately $34 million including more than $30.1 million in federal IIJA funding and $397,000 in SB1 funding toward median barrier and culvert repairs and roadway improvements on U.S. 101 near Willits from north of West Road to South of the Haehl Bridge in Mendocino County.
• Approximately $2.2 million toward the removal of hazardous trees on U.S. 101, and Routes 199 and 254 at various locations in Humboldt, Del Norte and Mendocino counties.
SB 1 provides $5 billion in transportation funding annually that is shared equally between the state and local agencies.
Road projects progress through construction phases more quickly based on the availability of SB 1 funds, including projects that are partially funded by SB 1.
For more information about transportation projects funded by SB 1, visit RebuildingCA.ca.gov.
LAKE COUNTY, Calif. — On the advice of the new treasurer-tax collector, the Board of Supervisors this week turned down a purchase offer from a newly formed nonprofit for hundreds of properties that didn’t sell in the June tax default property sale.
Treasurer-Tax Collector Patrick Sullivan urged the board not to accept the offer from North State Solutions, based in Chico, for numerous reasons, ranging from the below-market-value offer to the challenge of monitoring the project.
“My office has a number of concerns about this application,” he said Tuesday evening.
Brenda Pickern of Chico submitted filings to the Secretary of State’s Office on Sept. 4 to form North State Solutions, the specific purpose of which “is to acquire single-family dwellings for rehabilitation and sale to low-income persons, vacant land for construction of low-income housing, or vacant land to be dedicated to public use.”
Pickern is a disability rights advocate who also has filed numerous lawsuits against businesses — including Safeway and Pier 1 Imports — due to accessibility issues.
While North State Solutions has filed with the Secretary of State, it so far is not shown as having been registered in the California Attorney General’s Office online database of charitable organizations.
Eight days after filing with the Secretary of State’s Office, Pickern’s organization transmitted an offer to the Treasurer-Tax Collector’s Office to purchase all remaining tax-defaulted properties that did not sell at the June 2022 sale, Sullivan said.
Altogether, North State Solutions offered to purchase the 548 remaining properties for $354,934.60 in cash, which Sullivan said actually represented 5% of the land value and is “a significant potential discount from the assessed value.”
He said the offer came in the form of an “Application to Purchase Tax Defaulted Property” using a template designated by the State Controller’s Office.
Sullivan’s written report said sales of this type are permissible pursuant to Chapter 8 of the Revenue and Taxation Code.
“Eligible entities include government agencies and nonprofit organizations, for purposes including the utilization of vacant land for public use, including preservation of open space; rehabilitation or construction of residential dwellings for either sale or rent to low-income persons; or for other use to serve low-income persons,” his written report explained.
Sullivan said North State Solutions “may preliminarily meet the criteria for eligibility,” however, he couldn’t recommend approving the proposed agreement.
While his office encourages Chapter 8 sales to agencies and nonprofit organizations, “these proposals should generally be more targeted to specific properties with a carefully proposed project,” Sullivan wrote.
“In this case, North State, a newly created entity without a record of experience in this field, has submitted a proposal that is beyond the typical scope of such an offer, which can impose a substantial burden on County staff. The properties included in this proposal are from a variety of locations throughout the County with varying types of zoning, making the monitoring of this agreement challenging,” he said in his written report.
He told the board on Tuesday, “There’s not really any rhyme or reason geographically,” with the properties in question including some paper lots.
Sullivan said the scope of the application and the purchase offer “is just too vast for us to take on,” and it would place a significant burden on his office and also would require assistance from other county departments.
For that reason, he suggested denial. Until the offer was addressed, Sullivan said he couldn’t offer the properties to other agencies or put them back up for future tax sale.
The board took Sullivan’s suggestion and unanimously voted to deny the proposal.
Lake County News reviewed about 30 lots in the Lucerne area that were included in the proposed sale agreement. While about seven or eight appeared to be buildable, the rest were not, and either were located on creeks along roadsides or in the paper subdivisions above town.
The county’s 2015 paper lot subdivision management plan had stated that the county had been pulling paper lots from tax sales in order to prevent them from recirculating and being sold and resold as they have been for nearly a century.
Lake County News followed up with Sullivan on the issue of paper lots getting back onto the tax sale list.
Sullivan, who took office at the start of January, said in an email that based on what he’s learned over the past month, “the best available list of paper subdivision parcels is not comprehensive, so there were still paper parcels that slip into the auctions.There are also parcels that share those characteristics that do not actually fall into those one of the identified subdivisions.”
Sullivan added, “The County has now committed to attempting to sell 1,000 tax defaulted properties per year to clear the existing tax defaulted inventory, so that prior directive not to list them is now removed.”
He said he has plans moving forward to address the problem of the paper subdivision lots, which he said will need to be developed over the next several months.
Sullivan’s plans include creating a low value ordinance to take to the Board of Supervisors, building a list of parcels for which the debt could be discharged, doing outreach to agencies and nonprofits that would be interested in purchasing such properties — an action already being discussed with the city of Clearlake — and also pursuing bids from adjacent landowners.
Based on recent data, Sullivan concluded that there are less than 1,300 tax defaulted properties eligible for sale with an assessed value over $5,000. Many of those properties will be included on a list being developed for the May tax default sale.
As such, Sullivan said he has to develop his actions to address the paper lots quickly. Otherwise, starting in the fall, when the next auction list goes into development, “the County’s remaining inventory would begin to exist solely of the low value parcels other than newly eligible defaulted properties.”
He added, “Given the default rate, we would find ourselves perpetually listing these parcel types in annual auctions, in a sporadic manner and at great expense.”
Sullivan wants to provide the county with an opportunity to develop a plan to address the paper subdivisions “without thousands of them appearing in tax sales where individual buyers may be purchasing without the intent or capacity to address the existing issues.”
Email Elizabeth Larson at This email address is being protected from spambots. You need JavaScript enabled to view it.. Follow her on Twitter, @ERLarson, or Lake County News, @LakeCoNews.
LAKE COUNTY, Calif. — If invasive mussels were to get into Clear Lake, how would the county of Lake respond?
The Lake County Water Resources Department, partnering with the U.S. Fish and Wildlife Service and consultants at Creative Resource Strategies, invites the public to attend a virtual forum to discuss how the county will respond in the event invasive quagga or zebra mussels become introduced or established in Clear Lake.
The forum will be held at 10 a.m. Thursday, Feb. 2, via Zoom.
Anyone that has a business or residence in Lake County, and/or values or recreates on Clear Lake or other lakes in the county is encouraged to participate in the webinar.
Clear Lake is the largest natural freshwater lake located entirely in California, and consistently ranks among Bassmaster’s top 10 bass fishing lakes.
Although Clear Lake provides ideal water quality conditions and habitat for an established mussel introduction, Clear Lake currently has no quagga or zebra mussels.
Lake County relies on a prevention program supported primarily through state grants. Local mussel stickers are also sold.
Clear Lake is the county's central feature, providing economic and ecological stability to the entire region.
However, the popularity and accessibility of Clear Lake, combined with water quality conditions optimal for mussel establishment, mean risk of invasive mussel invasion is extremely high.
The Feb. 2 webinar will share information on the invasive mussel rapid response and containment transition project, which is intended to improve the current Clear Lake aquatic invasive species program while preparing for an invasive mussel introduction to Clear Lake or Lake County.
The webinar will share the goals of the project and the approach that will be taken to achieve those goals, the timeline and products.
A containment and transition plan, feasibility analysis for permanent watercraft decontamination stations, and assessment of regulations and ordinances are three key outcomes.
Information regarding consequences to Clear Lake and neighboring lakes from a mussel invasion will also be shared, including potential impacts to county revenue and property values, effects on native fish and wildlife, and increased costs and maintenance for all water suppliers and self-supplied water users.
By preparing for an invasion, the county is seeking to mitigate effects to the local economy and natural resources.
The county said the commitment of local residents, boat ramp monitors, and county, state and federal agency personnel has been critical to preventing quagga and zebra mussel introduction in Clear Lake.
“Continued vigilance and collective action is essential; relenting in this important effort could invite far-reaching environmental and economic harm,” the county said in a statement on the meeting.
If you have any questions or need more information, please contact the Water Resources Department at This email address is being protected from spambots. You need JavaScript enabled to view it. or by phone, at 707-263-2344.
Also visit the Water Resources Departments’ website or the Lake County Water Resources Department Facebook page, @lakecountywater.
LAKEPORT, Calif. — Police have arrested a young Lakeport man in connection to a series of burglaries and thefts.
Jordan Daniel Alger, 18, is the suspect in those cases, police said.
Over the past several weeks, Lakeport Police Department officers have been investigating a series of residential burglaries, thefts and vehicle thefts.
In addition to two vehicles, the stolen items included thousands of dollars of tools, firearms and other items.
Numerous LPD officers were involved in the ongoing and active investigation and, from multiple methods, were able to identify Alger as a suspect.
On Jan. 7, the Lakeport Police Department arrested Alger for burglary, conspiracy, possession of a controlled substance and possession of drug paraphernalia.
Subsequently, Alger was identified as a suspect in a total of five additional cases, including the ones described above that involved vehicles, burglary and theft of firearms.
While the investigation was active, the Lake County Sheriff’s Office arrested Alger in another part of Lake County on several charges, including possession of controlled substances while armed with a loaded firearm and possession of a short-barrel rifle. He has been in custody since Jan. 20.
During followup investigations this week, Lakeport Police officers recovered a stolen vehicle in Nice which was connected to Alger.
Additionally, a stolen gun belt from one of the Lakeport burglaries was in the vehicle, police said.
Based on all the evidence, facts and circumstances gathered to date, Lakeport Police officers are placing additional charges and booking Alger on two counts of felony vehicle theft, two counts of burglary, felony conspiracy and felony theft of a firearm.
Based on an affidavit from Lakeport Police requesting bail enhancement, a Lake County Superior Court Judge set bail on these charges at $250,000.
“Our investigation remains active, and we seek additional leads that may connect Alger to additional crimes while Alger remains in custody,” police sadi in a Frida statement.
Anyone with information related to Alger’s criminal activities in January is asked to contact Lakeport Police Sgt. Andrew Welter at 707-263-5491, This email address is being protected from spambots. You need JavaScript enabled to view it., by submitting an anonymous tip by texting the words TIP LAKEPORT followed by your message to 888777 or by sending police a private Facebook message at https://www.facebook.com/LakeportPolice/.
"Terry." Courtesy photo. CLEARLAKE, Calif. — Clearlake Animal Control has more new dogs waiting to be adopted this week.
Among those still waiting for homes is Terry, a 3-year-old shepherd mix with a short brown coat.
Staff said he has been neutered and so is ready to go to a new home.
The shelter reported that Snowball, who was at the shelter for several months, has been adopted and is enjoying life in his new home.
There currently are 41 adoptable dogs at the shelter, with staff hoping to find them loving homes.
The shelter is located at 6820 Old Highway 53. It’s open from 9 a.m. to 6 p.m. Tuesday through Saturday.
For more information, call the shelter at 707-762-6227, email This email address is being protected from spambots. You need JavaScript enabled to view it., visit Clearlake Animal Control on Facebook or on the city’s website.
This week’s adoptable dogs are featured below.
Email Elizabeth Larson at This email address is being protected from spambots. You need JavaScript enabled to view it.. Follow her on Twitter, @ERLarson, or Lake County News, @LakeCoNews.
LAKE COUNTY, Calif. — As more boaters are getting out on Clear Lake in the wake of the recent storms, local officials are urging caution.
Stormwater runoff from recent rains has washed trees and other floating debris into the Clear Lake.
The Lake County Water Resources Department advises county residents and visitors to take caution to avoid such hazards when boating.
Some logs appear small on the surface; please be aware, they could be mostly submerged.
Lake County Water Resources Department advises boaters to maintain a safe speed and keep a clear line of vision ahead of their vessel, especially in dusk and dawn hours, when light is limited.
The Water Resources Department will patrol the lake and remove hazardous floating debris. However, boaters should remain alert and aware of their surroundings as more rain and debris flow is expected.
Contact the Lake County Water Resources Department at 707-263-2344 if you have questions or concerns about lake debris.
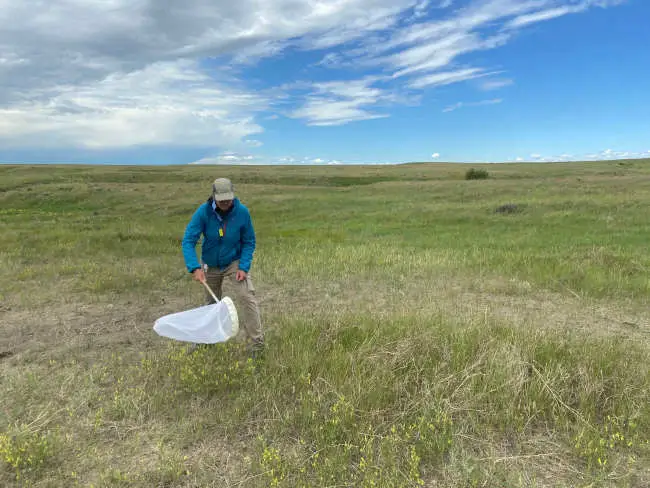
USGS scientist Tabitha Graves collects western bumble bee samples in eastern Montana. Courtesy image. BOZEMAN, Mont. — The western bumble bee was once common in western North America, but increasing temperatures, drought, and pesticide use have contributed to a 57% decline in the occurrence of this species in its historical range, according to a new U.S. Geological Survey-led study.
Using data from 1998 to 2020, scientists determined that increasing summer temperatures and drought partly drove declines of the native western bumble bee in recent decades, with rising temperatures being particularly important. The decline in pollinators is a cause for concern because most flowering plants depend on pollinators such as the western bumble bee to promote reproduction. Pollinators are also essential to our agriculture industry and economy and provide fruits, seeds and nuts that both humans and wildlife rely on. To further complicate matters for the western bumble bee, climate change continues to make rising temperatures and drought more common in the western states.
“There has been an ongoing global decline in pollinators, including in North America,” said Will Janousek, USGS scientist and co-lead author of the study. “The decline in the once common western bumble bee shows that common, widespread species are not excluded from this trend and our study showed that climate change is an important reason for the decline of this native bee species.”
The research team found another reason for the reduced distribution of the once common western bumble bee in a pesticide use dataset spanning 2008-2014: a group of insecticides called neonicotinoids, which are commonly used in agriculture. In areas where neonicotinoids were applied, the western bumble bee was less likely to occur and as the rate of neonicotinoid application increased, the bumble bee’s presence declined further.
The scientists also projected the future status of the western bumble bee in 16 regions of the western United States in the 2050s under different future scenarios, considering increasing levels of future climate stressors, changing forest and shrub cover, and other factors.
“Even considering the most optimistic scenario, western bumble bee populations are expected to continue to decline in the near future in nearly half of the regions across the bumble bee’s range,” said Tabitha Graves, USGS scientist and co-lead author on the study. “Considering the more severe, but probably more likely scenarios, western bumble bee populations are expected to decline an additional 51% to 97% from 2020 levels depending on the region.”
This study was a collaborative effort between the USGS, U.S. Fish and Wildlife Service, U.S. Department of Agriculture-Agriculture Research Service, Dickinson College, Canadian Wildlife Service, Montana State University, Xerces Society for Invertebrate Conservation, University of Colorado Boulder, The Ohio State University, and the University of Wyoming. It is published in the journal Proceedings of the National Academy of Sciences. For more information on bumble bee research in the West, please visit the USGS Northern Rocky Mountain Science Center website.
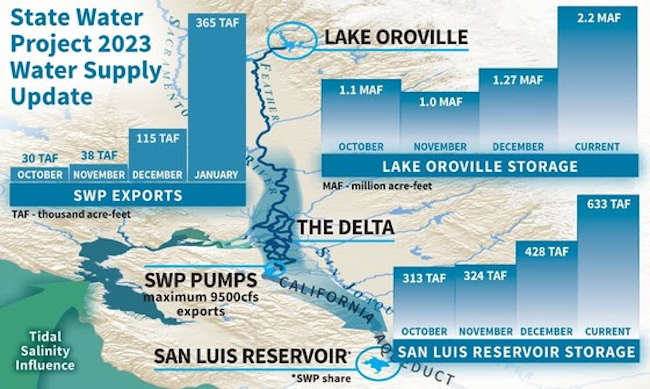
The Department of Water Resources on Thursday announced that recent storms will allow the State Water Project to boost deliveries to 29 public water agencies serving 27 million Californians.
Based on the amount of water captured and stored in recent weeks, DWR now expects to deliver 30 percent of requested water supplies — or 1.27 million acre-feet — in 2023, up from the initial 5 percent announced on Dec. 1.
The allocation increase is the direct result of extreme weather in late December and nine atmospheric rivers in early January that helped fill reservoirs and dramatically increase the Sierra Nevada snowpack.
The SWP’s two largest reservoirs (Oroville and San Luis) have gained a combined 1.62 million acre-feet of water in storage — roughly enough to provide water to 5.6 million households for a year.
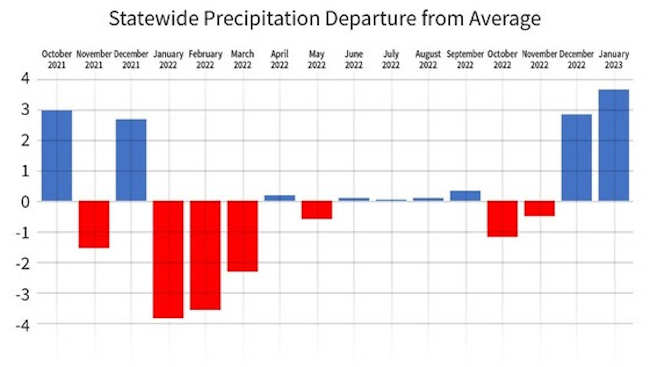
While Water Year 2023 began with below average precipitation, conditions shifted to extreme above average conditions.
Statewide Precipitation from Departure to Average Graph From October 2021 to January 2023 “We are pleased that we can increase the allocation now and provide more water to local water agencies,” said DWR Director Karla Nemeth. “These storms made clear the importance of our efforts to modernize our existing water infrastructure for an era of intensified drought and flood. Given these dramatic swings, these storm flows are badly needed to refill groundwater basins and support recycled water plants.”
The updated SWP delivery forecast takes into account current reservoir storage and is based on a conservative runoff forecast. It does not take into account the current Sierra Nevada snowpack.
DWR will conduct snow surveys on Feb. 1, March 1, April 1, and May 1 and may further update the allocation as the water supply outlook becomes clearer with the new data.
In addition to on the ground surveys, DWR will gather data from its Airborne Snow Observatory, or ASO, surveys.
For the second year in a row, DWR is broadening the deployment of these more sophisticated technologies, such as ASO surveys, that can collect snow measurements farther upslope of the Sierra Nevada.
The data from these flights, which use LIDAR and spectrometer technology to measure snowpack across broad swathes of key watersheds, will be used by DWR to get a more accurate account of California’s snowpack and to update water supply runoff forecasts.
Since the storms California experienced this month saw variable snow elevations, the data from ASO flights will help DWR verify snow course and snow sensor data and understand how snow has been distributed across the Sierra Nevada.
DWR cautioned that while recent storms have been impressive, two months remain in the wet season and California could see a return to warm and dry conditions prior to April 1.
Californians should continue to use water wisely to help the state adapt to a hotter, drier future and the possible return of drought.
The SWP pumps currently are operating at maximum capacity of 9,500 cubic feet per second, or CFS, and will continue to be adjusted as needed to meet State and federal requirements.
However, had the proposed Delta Conveyance Project been in place, the SWP could have stored an additional 202,000 acre-feet of water — enough to supply more than 710,000 households for a year — between Jan. 1 and Jan. 23 while staying within compliance of rules to protect endangered species.
California traditionally receives half its rain and snow by the end of January. Water managers will reassess conditions monthly throughout the winter and spring. Starting in February, the assessments will incorporate snowpack data and runoff forecasts.
Water managers will be monitoring how the wet season develops and whether further actions may be necessary later in the winter. Additional actions that have been taken previously, such as submission of a Temporary Urgency Change Petition or installation of the West False River Emergency Drought Salinity Barrier in the Sacramento-San Joaquin Delta, are unlikely this year based on current conditions.
Each year, DWR provides the initial SWP allocation by Dec. 1 based on available water storage, projected water supply, and water demands.
Allocations are updated monthly as snowpack and runoff information is assessed, with a final allocation typically determined in May or June.
The lowest initial SWP allocation was zero percent on Dec. 1, 2021, with limited water designated only for any unmet human health and safety needs.
Last year’s final allocation was 5 percent plus unmet human health and safety needs. Four of the 29 State Water Contractors ultimately requested and received additional human health and safety water supply.
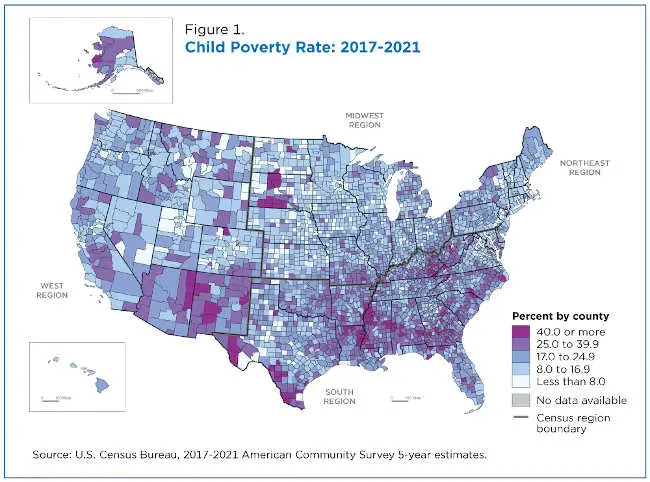
Poverty rates for children (under age 18) in U.S. counties are wide-ranging, from less than 1.0% to 72.7%, according to the American Community Survey (ACS) 5-year estimates.
The U.S. Census Bureau’s 2017-2021 ACS differs from the 1-year estimates released in September because it pools five consecutive years of 1-year estimates. This allows us to estimate poverty in geographies with smaller populations, including all 3,143 counties in the United States.
This article focuses on the poverty rates of the nation’s youngest and oldest age groups at the county level. It also analyzes the change in rates from the 2012-2016 ACS to the subsequent period of 2017-2021.
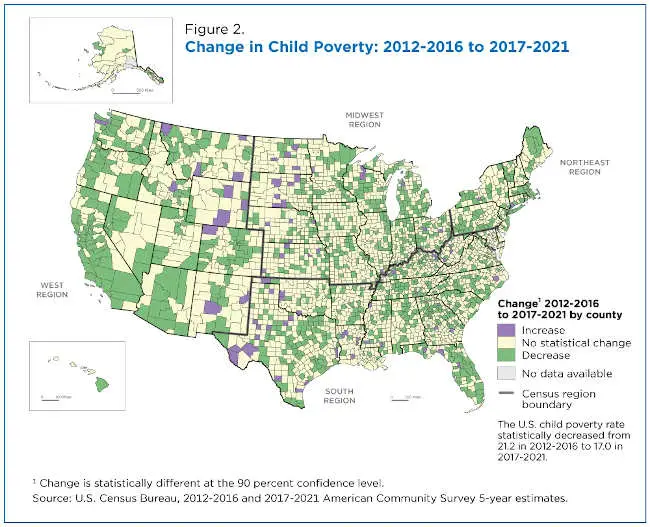
According to the new estimates, the national child poverty rate declined from 21.2% in the 2012-2016 period to 17.0% in the 2017-2021 period. But it was still 4.4 percentage points higher than the ACS national overall poverty rate of 12.6% during the same period.
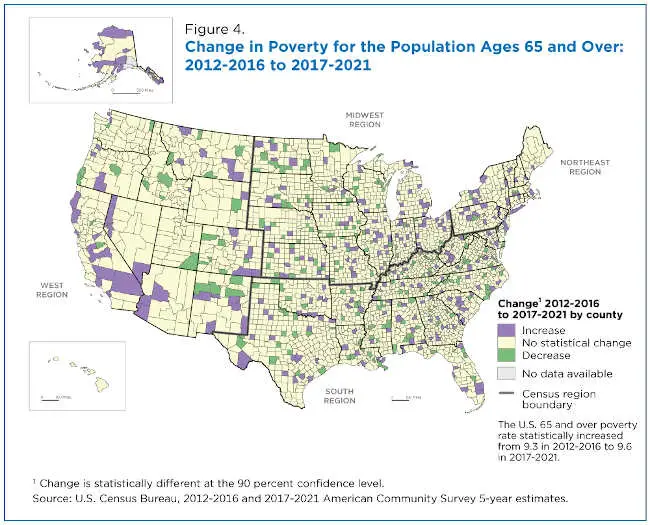
In contrast, the poverty rate (9.6%) of people ages 65 and older during the 2017-2021 period was 3 percentage points lower than the overall rate.
How poverty is measured
Government agencies, researchers and local organizations regularly use poverty estimates to measure economic well-being and identify the number of individuals and families eligible for various assistance programs.
Poverty status is determined by comparing annual income to a set of dollar values (called poverty thresholds) that vary by family size, number of children and age of the householder.
The poverty threshold differs for individuals and families of different sizes.
A family and each individual member of that family are considered in poverty if the family’s before-tax money income is less than the dollar value of its threshold. Poverty status of people not living in families is determined by comparing an individual’s income to their poverty threshold.
The poverty measure excludes children under the age of 15 who are not related to the householder and people living in institutional group quarters, college dormitories or military barracks. Population totals in this article include only those whose poverty status can be determined.
Child poverty by county and region
Only 117 (or 3.7%) of the nation’s counties – more than half with a poverty universe population of less than 10,000 – had poverty rates of 40% or more. The majority (81.2%) of them were in the South.
Conversely, 302 U.S. counties, 9.6% of all counties, had a child poverty rate below 8%. Nearly half (146) of them were in the Midwest.
Figure 1 illustrates the uneven distribution of child poverty in U.S. counties.
Change From 2012-2016 to 2017-2021
Child poverty rates changed significantly in 1,104 counties from 2012-2016 to 2017-2021 (Figure 2):
• Child poverty rates declined in 1,017 counties. • 43% of counties with declining child poverty rates were in the South. • Child poverty rates increased in far fewer counties (87). Over half were in the South.
Poverty rates of older populations by county and region
The poverty rate for people ages 65 and over increased from 9.3% in 2012-2016 to 9.6% in 2017-2021 but rates varied widely across counties – from less than 1.0% to 47.9%.
As with child poverty, there were regional clusters of high- and low-poverty counties (Figure 3).
There were 201 counties with less than 5.0% of individuals ages 65 and up in poverty; 41.8% of them were in the Midwest.
Conversely, there were 76 counties with poverty rates at or above 22.0% for people ages 65 and over; 73.7% of them were in the South.
From 2012-2016 to 2017-2021, 513 counties experienced a significant change in poverty rates for people ages 65 and over: 282 counties had an increase, and 231 counties a decrease (Figure 4).
Of the counties with declining rates, nearly 200 (86%) were in the South or Midwest. Within individual regions, 8.4% of all counties in the South had declining poverty rates; 7.6% in the Midwest; 6.0% in the West; and 2.3% in the Northeast.
Of the counties with increased rates of poverty among people ages 65 and over, 39.4% were in the South. Regionally, 14.8% of all counties in the Northeast had increasing rates compared to 11.6% in the West; 8.2% in the Midwest; and 7.8% in the South.
More counties saw poverty rates among older populations increase than decrease from 2012-2016 to 2017-2021, the opposite of the pattern seen among children.
Poverty rates among the 65-plus population increased in 282 counties from 2012-2016 to 2017-2021. Of these counties, 108 experienced declines in child poverty rates and five increases in poverty rates in both age categories.
Of the 231 counties with declining poverty rates for those 65 and over, 88 also had declining child poverty rates and four had increases.
In the Northeast, 0.9% of counties had an increase in child poverty rates but 14.8% of counties showed an increase in the poverty rate of those ages 65 and over. Similarly, only 2.7% of counties in the West had an increase in child poverty rates but 11.6% had an increase in poverty rates of the older population.
Additional poverty data are available at data.census.gov and this topics page provides links to poverty estimates from other surveys such as the Current Population Survey Annual Social and Economic Supplement (CPS ASEC) and the Survey of Income and Program Participation (SIPP). Small Area Income and Poverty Estimates (SAIPE) are also available.
Craig Benson is a survey statistician in the Census Bureau’s Poverty Statistics Branch.

 How to resolve AdBlock issue?