LAKE COUNTY, Calif. – Two people were reported to have died in a head-on vehicle crash near Middletown late Saturday night.
The crash occurred on Highway 29 near the entrance to the Bar X Ranch north of Middletown shortly after 11 p.m. Saturday, according to the California Highway Patrol and radio reports.
The wreck involved what the CHP described as a white van and a black pickup truck.
Authorities arriving at the scene found the highway completely blocked, with major injuries to two people who were trapped in one of the vehicles.
An air ambulance was requested to land at the Middletown Fire Station, with the CHP’s H-32 helicopter responding from Napa County. Oher air ambulances said they couldn’t take the flight due to weather, based on radio reports.
Just after 11:30 p.m., one of the trapped patients was reported to have died and the Lake County Sheriff’s Office was requested to send a coroner.
As firefighters continued to extricate the second patient, incident command asked Cal Fire Dispatch to notify Caltrans about the need for an extended closure of the highway.
The CHP helicopter had already landed at the fire station when, just before 12:10 a.m. Sunday, firefighters finished extricating the second patient and incident command confirmed the second death over the radio.
Incident command reported just before 1 a.m. that Caltrans would need light towers and heavy debris removal equipment to clear the highway.
At that point, incident command said work was expected to continue at the crash scene for several hours.
More information will be published as it becomes available.
Email Elizabeth Larson at This email address is being protected from spambots. You need JavaScript enabled to view it.. Follow her on Twitter, @ERLarson, or Lake County News, @LakeCoNews.
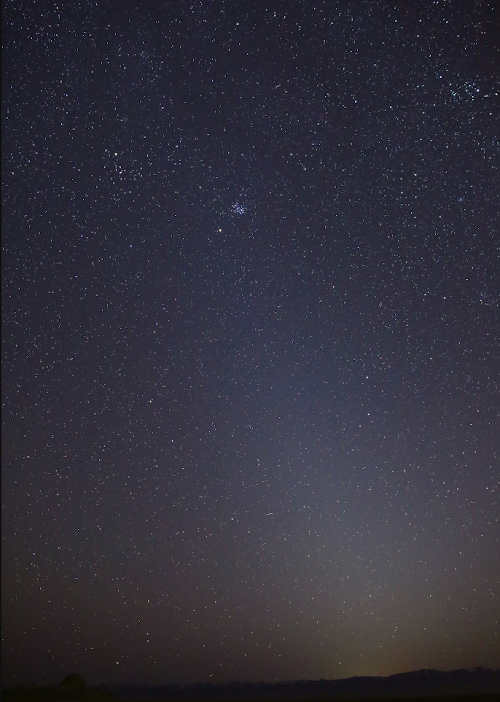
Look up to the night sky just before dawn, or after dusk, and you might see a faint column of light extending up from the horizon.
That luminous glow is the zodiacal light, or sunlight reflected toward Earth by a cloud of tiny dust particles orbiting the Sun.
Astronomers have long thought that the dust is brought into the inner solar system by a few of the asteroid and comet families that venture in from afar.
But now, a team of Juno scientists argues that Mars may be the culprit. They first published their finding online on Nov. 11, 2020, in the Journal of Geophysical Research: Planets, with a final peer-reviewed paper published on March 9, 2021.
An instrument aboard the Juno spacecraft serendipitously detected dust particles slamming into the spacecraft during its journey from Earth to Jupiter.
The impacts provided important clues to the origin and orbital evolution of the dust, resolving some mysterious variations of the zodiacal light.
Though their discovery has big implications, the scientists who spent years studying cosmic debris did not set out to do so. “I never thought we’d be looking for interplanetary dust,” said John Leif Jørgensen, a professor at the Technical University of Denmark.
Jørgensen designed the four star trackers that are part of Juno’s magnetometer investigation. These onboard cameras snap photos of the sky every quarter of a second to determine Juno’s orientation in space by recognizing star patterns in its images — an engineering task essential to the magnetometer’s accuracy.
But Jørgensen hoped his cameras might also catch sight of an undiscovered asteroid. So he programmed one camera to report things that appeared in multiple consecutive images but weren’t in the catalog of known celestial objects.
He didn’t expect to see much: Nearly all objects in the sky are accounted for in the star catalog. So when the camera started beaming down thousands of images of unidentifiable objects — streaks appearing then mysteriously disappearing — Jørgensen and his colleagues were baffled. “We were looking at the images and saying, ‘What could this be?’” he said.
An illustration shows NASA’s Juno spacecraft as it entered orbit of Jupiter on July 4, 2016, after traveling for nearly five years and more than 1.7 billion miles. Credits: NASA/JPL/SwRI. Jørgensen and his team considered many plausible and some implausible causes. There was the unnerving possibility that the star camera had caught a leaking fuel tank on Juno. “We thought, ‘Something is really wrong,’” Jørgensen said. “The images looked like someone was shaking a dusty tablecloth out their window.”
It wasn’t until the researchers calculated the apparent size and velocity of the objects in the images that they finally realized something: Dust grains had smashed into Juno at about 10,000 miles (or 16,000 kilometers) per hour, chipping off submillimeter pieces.
“Even though we’re talking about objects with only a tiny bit of mass, they pack a mean punch,” said Jack Connerney, Juno’s magnetometer investigation lead, and the mission’s deputy principal investigator, who’s based at NASA’s Goddard Space Flight Center in Greenbelt, Maryland.
As it turned out, the spray of debris was coming from Juno’s expansive solar panels — the biggest and most sensitive unintended dust detector ever built.
“Each piece of debris we tracked records the impact of an interplanetary dust particle, allowing us to compile a distribution of dust along Juno’s path,” Connerney said. Juno launched in 2011. After a deep-space maneuver in the asteroid belt in 2012, it returned to the inner solar system for an Earth gravity assist in 2013, which catapulted the spacecraft towards Jupiter.
This visualization shows NASA’s Juno’s spacecraft on its five-year flight path to Jupiter, beginning with its launch from NASA’s Kennedy Space Center in Florida in 2011.
Connerney and Jørgensen noticed that the majority of dust impacts were recorded between Earth and the asteroid belt, with gaps in the distribution related to the influence of Jupiter’s gravity. According to the scientists, this was a radical revelation.
Before now, scientists have been unable to measure the distribution of these dust particles in space. Dedicated dust detectors have had limited collection areas and thus limited sensitivity to a sparse population of dust. They mostly count the more abundant and much smaller dust particles from interstellar space. In comparison, Juno’s expansive solar panels have 1,000 times more collection area than most dust detectors.
Juno scientists determined that the dust cloud ends at Earth because Earth’s gravity sucks up all the dust that gets near it. “That’s the dust we see as zodiacal light,” Jørgensen said.
As for the outer edge, around 2 astronomical units (AU) from the Sun (1 AU is the distance between Earth and the Sun), it ends just beyond Mars. At that point, the scientists report, the influence of Jupiter’s gravity acts as a barrier, preventing dust particles from crossing from the inner solar system into deep space. This same phenomenon, known as orbital resonance, also works the other way, where it blocks dust originating in deep space from passing into the inner solar system.
The profound influence of the gravity barrier indicates that the dust particles are in a nearly circular orbit around the Sun, Jørgensen said. “And the only object we know of in almost circular orbit around 2 AU is Mars, so the natural thought is that Mars is a source of this dust,” he said.
This photo shows the zodiacal light as it appeared on March 1, 2021, in Skull Valley, Utah. The Pleiades star cluster is visible near the top of the light column. Mars is just below that. Credits: NASA/Bill Dunford. “The distribution of dust that we measure better be consistent with the variation of zodiacal light that has been observed,” Connerney said.
The researchers developed a computer model to predict the light reflected by the dust cloud, dispersed by gravitational interaction with Jupiter that scatters the dust into a thicker disk.
The scattering depends only on two quantities: the dust inclination to the ecliptic and its orbital eccentricity. When the researchers plugged in the orbital elements of Mars, the distribution accurately predicted the tell-tale signature of the variation of zodiacal light near the ecliptic.
“That is, in my view, a confirmation that we know exactly how these particles are orbiting in our solar system,” Connerney said, “and where they originate.”
While there is good evidence now that Mars, the dustiest planet we know of, is the source of the zodiacal light, Jørgensen and his colleagues cannot yet explain how the dust could have escaped the grip of Martian gravity. They hope other scientists will help them.
In the meantime, the researchers note that finding the true distribution and density of dust particles in the solar system will help engineers design spacecraft materials that can better withstand dust impacts. Knowing the precise distribution of dust may also guide the design of flight paths for future spacecraft in order to avoid the highest concentration of particles. Tiny particles traveling at such high velocities can gouge up to 1,000 times their mass from a spacecraft.
Juno’s solar arrays escaped harm because the solar cells are well protected against impact on the back — or dark — side of the array by the support structure.
Lonnie Shekhtman works for NASA’s Goddard Space Flight Center in Greenbelt, Maryland.
NORTHERN CALIFORNIA – A unified command of numerous state and regional agencies is continuing in response to the grounded vessel near Dillon Beach in Marin County, with a virtual open house planned on Saturday afternoon.
The 90-foot American Challenger grounded early on the morning of March 6. It was being towed southward by the Tug Hunter from Puget Sound, Washington, when the Tug Hunter lost propulsion due to a rope entangling the propeller.
On Friday, Coast Guard Pacific Strike Team members conducted a drone overflight to assess the American Challenger. There were no new reports of sheening.
Environmental shoreline assessment teams continued to conduct surveys in the area with no reports of debris.
There have been no confirmed reports of oiled wildlife. If oiled wildlife is seen, the public is asked not to approach and contact the Oiled Wildlife Care Network at 1-877-823-6926.
The unified command is scheduled to host a virtual open house for the public Saturday from 2 p.m. to 4 p.m. at https://us02web.zoom.us/j/87996831064, where staff will present information on the current status and future plans of the response.
About 46 million Americans – 14% of the nation’s inhabitants – are currently classified as living in rural areas. That number could jump to 64 million – an increase of nearly 40% – without anyone moving into a new home. That could actually hurt small cities and rural communities across the country.
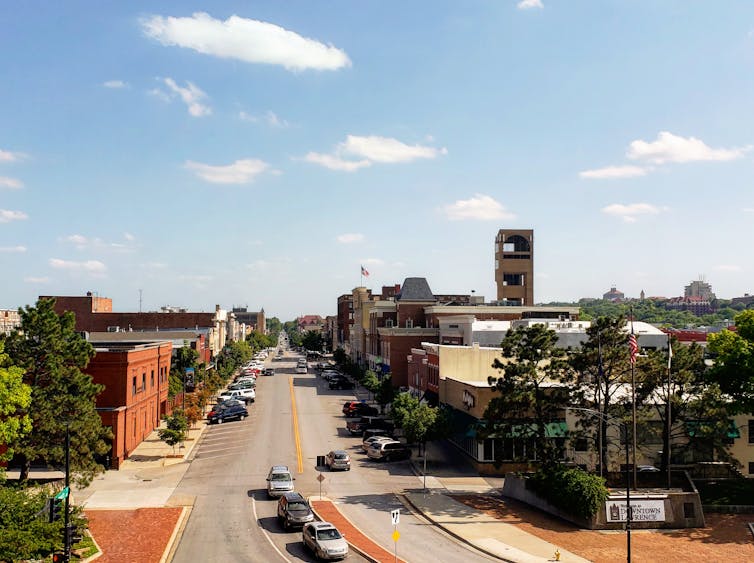
The main dividing line is between communities – which include both towns and cities and their surrounding counties – with more than 50,000 people and those with fewer than that number. Over the past 70 years, the number of areas with at least that many people has increased from 168 to 384 as small towns have grown into small cities. For example, from 1950 to 2010, the population of Lawrence, Kansas, grew from 23,351 to 87,643.
Under the current definition, Colbert County, Alabama – population 54,428 – is in the same category as Los Angeles County – population over 10 million. As the Trump administration ended, federal officials decided some more nuance would be useful in understanding American communities. They proposed to change the dividing line to populations of more than 100,000 – and the effort appears to be continuing under the Biden administration.
That change would effectively move everyone who lives in places with 50,000 to 100,000 from urban to rural life, because their cities, including San Luis Obispo, California, and Battle Creek, Michigan, will no longer be considered large enough to count as metropolitan.
Redefining rural
The government doesn’t specifically use this system to label places as “urban” or “rural.” Instead, there are three government categories – “metropolitan,” “micropolitan” and “outside a core based statistical area.” However, most government agencies, researchers, advocates and media outlets use these classifications to sort communities into two groups – equating “metropolitan” with “urban” and the other two categories together as “rural.”
Making the proposed change would mean 144 areas with populations between 50,000 and 100,000, and the 251 counties they occupy, would no longer be classified as “metropolitan,” but rather as “micropolitan” – and therefore effectively rural – including Flagstaff, Arizona, and Blacksburg, Virginia. The change would leave Wyoming without any metropolitan areas at all.
The Office of Management and Budget is accepting comments about this proposed change until March 19.
But if the homes and communities of 18 million more Americans are added to those rural statistics, the numbers could look better. That rosier picture – which would not be the result of any actual changes to Americans’ lives – could reduce public and political pressure to improve life in rural communities.
It’s also not clear whether 100,000 is the right boundary for urban living – or of there is an exact number at all. To people in major cities, a community of 80,000 like Santa Fe, New Mexico, may be more similar to the 22,000-person Roseburg, Oregon, than to Chicago or Miami. To a rancher on the Plains, with fewer than one person per square mile, though, Santa Fe may qualify as a “big city,” with chain stores, hospitals and government offices.
The change could make many small American cities, which would be newly identified as rural, ineligible for money to help community planning and public transit – even if they currently get that money.
Communities currently designated as rural may be hurt, too. If Congress and states don’t allocate more funds to serve the increased number of people classified as living in rural areas, the money that is available – like rural health grants – would be spread more thinly.
Lakeport City Councilwoman Mireya Turner. Photo courtesy of the city of Lakeport. LAKEPORT, Calif. – The National League of Cities has announced the election of Lakeport City Councilmember Mireya Turner to three committees within the organization that is a resource and advocate for 19,000 cities, towns and villages, representing more than 218 million Americans.
Turner is serving her second term on the Lakeport City Council. During her time on the council, she also has served as mayor.
“I am honored to serve on these committees, and am excited to take the rural, small city voice of Lakeport to the national table on these important issues,” Turner told Lake County News.
In addition to her efforts on behalf of the city of Lakeport, Turner is the planning manager for the city of Ukiah.
National League of Cities, or NLC, committees and councils bring together leaders from communities that are similar in size, type or another important characteristic.
Turner will represent the city of Lakeport and the Redwood Empire Division of the League.
“These appointments are a big deal for Lakeport to be represented at the national level by Councilmember Turner. We appreciate and applaud her engagement with the NLC’s advocacy efforts,” said City Manager Kevin Ingram.
The Community and Economic Development Committee is responsible for developing policy positions and leading NLC’s advocacy on issues involving housing, community and economic development, land use, recreation and parks, historic preservation and international competitiveness.
In addition, the committee leads efforts in support of federal grant programs that support these activities, including the Community Development Block Grant program.
Turner was elected to a one-year term, announced by NLC President Kathy Maness, councilmember for Lexington, South Carolina.
“Our member councils are the voices of what’s happening on the ground in our communities,” said Maness. “I am proud to have Mireya Turner join these committees on behalf of her residents and the region.”
The Race, Equity and Leadership, or REAL, Council provides a space for local elected officials to connect on building equitable communities.
The leadership of the REAL Council offers tangible insights and opportunities to apply a racial equity lens within cities and within each NLC leadership structure.
As a member of the Small Cities Council, or SCC, Turner will participate in sharing ideas and creative solutions to challenges affecting small cities.
Small cities – those with populations of 50,000 or less – make up 80 percent of NLC membership.
The SCC advocates on behalf of America’s cities and towns before Congress, with the administration and at home.
A solar flare from AR 11944 emitted on January 7, 2014, seen in several different wavelengths of light from NASA’s Solar Dynamics Observatory. From right to left, the artificially-colored images show plasma at approximately 1 million degrees Fahrenheit, 4.5 million degrees Fahrenheit and 12.7 million degrees Fahrenheit. Credits: NASA/SDO. Zipping through space at close to the speed of light, solar energetic particles, or SEPs, are one of the main challenges for the future of human spaceflight.
Clouds of these tiny solar projectiles can make it to Earth – a 93 million-mile journey – in under an hour.
They can fry sensitive spacecraft electronics and pose serious risks to human astronauts. But their onset is extraordinarily hard to predict, in part because we still don’t know exactly where on the Sun they come from.
A new study tracing three SEP bursts back to the Sun has provided the first answer.
“We have for the first time been able to pinpoint the specific sources of these energetic particles,” said Stephanie Yardley, space physicist at the University College London and coauthor of the paper. “Understanding the source regions and physical processes that produce SEPs could lead to improved forecasting of these events.”
Study authors David Brooks, space physicist at George Mason University in Washington, D.C., and Yardley published their findings in Science Advances on March 3, 2021.
SEPs can shoot out from the Sun in any direction; catching one in the vastness of space is no small feat.
NASA’s Heliophysics System Observatory – a growing fleet of Sun-studying spacecraft, strategically placed throughout the solar system – was designed in part to increase the chances of those lucky encounters.
Scientists have divided SEP events into two major types: impulsive and gradual. Impulsive SEP events usually happen after solar flares, the bright flashes on the Sun produced by abrupt magnetic eruptions.
“There's this really sharp spike, and then an exponential decay with time,” said Lynn Wilson, project scientist for the Wind spacecraft at NASA’s Goddard Space Flight Center in Greenbelt, Maryland.
Gradual SEPs last longer, sometimes for days. They come in large swarms, making the blasts a bigger risk to astronauts and satellites.
Gradual SEPs are pushed along from behind by coronal mass ejections, or CMEs – large plumes of solar material that billow through space like a tidal wave. The SEPs act like surfers, caught by that wave and propelled to incredible speeds.
The greatest mystery about gradual SEPs is not what speeds them up, but where they come from in the first place.
For reasons still not fully understood, SEPs contain a different mix of particles than the other solar material streaming off the Sun in the solar wind – fewer carbon, sulfur, and phosphorous ions, for instance. Some scientists suspect they’re cut from an entirely different cloth, forming in a different feature or layer of the Sun than the rest of the solar wind.
To find out where SEPs come from, Brooks and Yardley traced gradual SEP events from January 2014 back to their origin on the Sun.
They started with NASA’s Wind spacecraft, which orbits at the L1 Lagrange point about 1 million miles closer to the Sun than we are. One of Wind’s eight instruments is the Energetic Particles: Acceleration, Composition, and Transport, or EPACT instrument, which specializes in detecting SEPs. EPACT captured three strong SEP blasts on January 4th, 6th and 8th.
Wind’s data showed that these SEP events indeed had a specific “fingerprint” – a different mix of particles than is typically found in the solar wind.
“There is often less sulfur in SEPs compared to the solar wind, sometimes a lot less” said Brooks, lead author of the paper. “This is a unique fingerprint of SEPs that allows us to search for places in the Sun's atmosphere where sulfur is also lacking.”
They turned to JAXA/NASA’s Sun-watching Hinode spacecraft, an observatory in which Brooks serves a critical operational role for NASA from Japan. Hinode was watching Active Region 11944, a bright area of strong magnetic field with a large dark sunspot visible from Earth. AR 11944 had produced several large flares and CMEs in early January that released and accelerated the SEPs Wind observed.
Hinode’s Extreme Ultraviolet Imaging Spectrometer, or EIS instrument, scanned the active region, breaking the light into spectral lines used to identify specific elements. They looked for places in the active region with a matching fingerprint, where the specific mix of elements agreed with what they saw in Wind’s data.
Closed magnetic field lines loop back to the Sun, surrounded by open field lines that reach out into space, as depicted in this illustration. Credits: NASA’s Goddard Space Flight Center/Lisa Poje/Genna Duberstein. “This type of research is exactly what Hinode was designed to pursue,” said Sabrina Savage, the U.S. project scientist for Hinode. “Complex system science cannot be done in a bubble with only one mission.”
Hinode’s data revealed the source of the SEP events – but it wasn’t what either Brooks or Yardley expected.
As a rule, the solar wind can escape more easily by finding open magnetic field lines – field lines anchored to the Sun at one end but streaming out into space on the other.
“I really thought we were going to find it at the edges of the active region where the magnetic field is already open and material can escape directly,” Brooks said. “But the fingerprint matched only in regions where the magnetic field is still closed.”
The SEPs had somehow broken free from strong magnetic loops connected to the Sun at both ends. These loops trap material near the top of the chromosphere, one layer below where solar flares and coronal mass ejections erupt.
“People have already been thinking about ways it could get out from closed field – especially in the context of the solar wind,” Brooks said. “But I think the fact that the material was found in the core of the region, where the magnetic fields are very strong, makes it harder for those processes to work.”
The surprising result raises new questions about how SEPs escape the Sun, questions ripe for future work. Still, pinpointing one event’s source is a big step forward.
“Normally, you have to infer this kind of thing – you’d say, ‘look we saw an SEP and a solar flare, and the SEP probably came from the solar flare,’” said Wilson, who wasn’t involved in the study. “But this is direct evidence tying these two phenomena together.”
Brooks and Yardley also demonstrate one way to use NASA’s growing Heliophysics System Observatory, combining multi-spacecraft observations to do science that previously wasn’t possible.
“It's a way of thinking about all the spacecraft that are in flight that you can use to do a single study,” Wilson said. “It's like having a bunch of weather stations — you start to get a much better picture of what the weather is doing on a larger scale, and you can actively start to try to predict it.”
“These authors have done a remarkable job combining the right data sets and applying them to the right questions,” Savage said. “The search for the origins of potentially harmful energetic particles has been critically narrowed thanks to this effort.”
The Department of Water Resources has released the draft California’s Groundwater – Update 2020, containing information on the condition of the state’s groundwater, which is especially important as California faces a critically dry water year.
DWR encourages community members and water managers to review the publication and provide input.
“Water touches nearly every aspect of our lives. Groundwater provides drinking water to millions of Californians, sustains natural environments and farms, and helps support jobs,” said DWR Director Karla Nemeth. “The information in California’s Groundwater – Update 2020 is vital to local water agencies and communities as they work on locally driven solutions for the long-term reliability of their groundwater.”
This version of California’s Groundwater provides a comprehensive look at statewide groundwater activities, compiling technical information and data from 2003 to 2020.
This bulletin recognizes the historic passage of the Sustainable Groundwater Management Act, or SGMA, in 2014 and builds a statewide framework to share new information and progress made by locals who are managing groundwater basins across the state.
It also highlights emerging topics such as water markets and the impacts of climate change on groundwater and summarizes groundwater information for each of the state’s 10 hydrologic regions.
The publication contains a Highlights overview section in English and Spanish, regional summaries and a detailed statewide report, which features current knowledge of groundwater resources including information on the location, characteristics, use, management status and conditions of the state’s groundwater. The publication also presents findings and recommendations that support the future management and protection of groundwater.
This information can help communities and local water managers work together to find unique ways to manage their groundwater basins for long-term reliability and support actions being implemented as part of Governor Gavin Newsom’s 2020 California Water Resilience Portfolio.
California’s Groundwater is organized to share the growing body of groundwater data that is available now and will continue to be submitted by local agencies in the future as part of the implementation of SGMA. DWR is developing a companion California’s Groundwater web-based dashboard leveraging the California Natural Resources Agency Open Data Platform to improve the access and timeliness of statewide groundwater information, making it easily available for water managers and the public to use.
DWR will present an overview of California’s Groundwater at a public webinar meeting on March 30, 2021, at noon.
A 45-day public comment period is now open on the draft report and companion web content. All comments will be reviewed and will provide valuable feedback to DWR to improve the analysis, reporting and access to California’s groundwater information. Public comments can be emailed to This email address is being protected from spambots. You need JavaScript enabled to view it. and will be accepted through April 26, 2021.
The final version of California’s Groundwater is expected to be released in summer 2021.
The California Department of Fish and Wildlife is inviting families across the state to participate in the fun and educational “Nature Bowl 2021: Family Challenge Edition.”
Nature Bowl has been an exciting science event for teams of third- through sixth-grade students for more than 35 years.
Last year saw the event canceled as a result of the COVID-19 pandemic.
This year, Nature Bowl has been reformatted for the times as a nature challenge to all California families with school-age students.
Just like the spring before us, it’s time for rejuvenation, time to emerge from winter hibernation, time to get outside and give your family a healthy dose of nature.
Your challenge is to work together as a family to compete in five nature-themed activities – and possibly win cool nature-related prizes.
Activity challenges:
– Nature relay: Take a scavenger hunt safari to see the natural world nearby. – Nature investigations: Discover native plants, animals in your backyard or neighborhood. – Bell ringers: Invent a fast-paced family game using Nature Bowl 2021 vocabulary. – Team problem solving: Decipher the events in 12 nature photographs. – Enviromercials: Create a 60-second ad on a current nature topic specific to California.
The Nature Bowl Family Challenge is open from March 15 through May 14.
Contact This email address is being protected from spambots. You need JavaScript enabled to view it. at CDFW’s North Central Region to register and receive your electronic entry package with details, worksheets and resources.
LAKE COUNTY, Calif. – Changes to the state’s COVID-19 Blueprint for a Safer Economy are expected to move 26 of California’s 58 counties – including Lake – out of the most restrictive purple tier and into the red tier over the coming week.
The California Department of Public Health said Friday that two million doses of COVID-19 vaccine have been administered to Californians in some of the state’s hardest-hit communities, increasing immunity where the state's transmission rates and disease burden have been the highest during the pandemic.
With this equity metric met, and because vaccines slow the spread of disease and serious illness, the previously announced update to the Blueprint for a Safer Economy to account for progress with vaccine administration goes into effect.
After reassessment using new thresholds, 13 counties will move to a less restrictive tier, from purple (widespread) to red (substantial): Amador, Colusa, Contra Costa, Los Angeles, Mendocino, Mono, Orange, Placer, San Benito, San Bernardino, Siskiyou, Sonoma and Tuolumne.
Twenty-one counties will remain in the purple tier, 33 will be in the red (substantial) tier, three remain in the orange (moderate) tier and one remains in the yellow (minimal) tier. These changes will take effect on Sunday, March 14.
On Tuesday, CDPH said it also expects Sacramento, San Diego and 11 additional counties – Kings, Lake, Monterey, Riverside, San Joaquin, Santa Barbara, Sutter, Tehama, Tulare, Ventura and Yuba – to shift from purple to red based on current data and projections.
These tier adjustments will be assigned on Tuesday and take effect on Wednesday.
Lake County has been in the purple tier since the end of November.
There is potential for additional counties to move tiers next week based on next week’s blueprint tier assessment and assignment.
Going forward, the purple tier threshold is greater than 10 cases per 100,000 people.
“California is doubling down on its mission to keep equity a top priority as we continue to get COVID-19 doses into the arms of all Californians as safely and quickly as possible,” said Dr. Mark Ghaly, secretary of California’s Health and Human Services Agency. “Focusing on the individuals who have been hardest hit by this pandemic is the right thing to do and also ensures we are having the greatest impact in reducing transmission, protecting our health care delivery system and saving lives.”
On March 4, Gov. Gavin Newsom announced that the state had set aside 40 percent of vaccine doses for the hardest-hit communities and established an equity metric to increase vaccinations in those communities. Doing so recognizes that the pandemic did not affect California communities equally.
Forty percent of COVID cases and deaths have occurred in the lowest quartile of the Healthy Places Index, which provides overall scores and data that predict life expectancy and compares community conditions that shape health across the state.
Six of Lake County’s zip codes – Clearlake, Clearlake Oaks, Finley, Lucerne, Nice and Upper Lake – are in the lowest quartile on the Healthy Places Index.
“While we have reached a milestone today, we still have a lot of work ahead of us to help ensure we can put an end to this pandemic,” said Tomás Aragón, CDPH director and state Public Health officer. “We must all do our part by getting vaccinated as soon as it’s our turn and continue to wear masks and practice physical distancing to keep our communities safe.”
The blueprint will be updated again when four million doses have been administered in the vaccine equity quartile.
More information about the Blueprint for a Safer Economy is available here and additional details on the state's efforts to end the pandemic through equitable vaccine administration is available here.
LAKE COUNTY, Calif. – Lake County Animal Care and Control has four dogs ready to be adopted this week.
Dogs available for adoption this week include mixes of basset hound, border collie, boxer and pit bull.
Dogs that are adopted from Lake County Animal Care and Control are either neutered or spayed, microchipped and, if old enough, given a rabies shot and county license before being released to their new owner. License fees do not apply to residents of the cities of Lakeport or Clearlake.
The following dogs at the Lake County Animal Care and Control shelter have been cleared for adoption (additional dogs on the animal control Web site not listed are still “on hold”).
This female boxer-pit bull mix is in kennel No. 18, ID No. 14356. Photo courtesy of Lake County Animal Care and Control.
Boxer-pit bull terrier mix
This female boxer-pit bull mix has a short red coat.
She is in kennel No. 18, ID No. 14356.
This young female border collie mix is in kennel No. 19, ID No. 14414. Photo courtesy of Lake County Animal Care and Control. Female border collie mix
This young female border collie mix has a medium-length black and white coat.
She is in kennel No. 19, ID No. 14414.
This senior male pit bull terrier is in kennel No. 22, ID No. 14392. Photo courtesy of Lake County Animal Care and Control. Male pit bull terrier
This senior male pit bull terrier has a short tan and white coat.
He is in kennel No. 22, ID No. 14392.
“Molly” is a senior female basset hound in kennel No. 27, ID No. 14410. Photo courtesy of Lake County Animal Care and Control. ‘Molly’
“Molly” is a senior female basset hound with a short tan and white coat.
She has been spayed.
She is in kennel No. 27, ID No. 14410.
Email Elizabeth Larson at This email address is being protected from spambots. You need JavaScript enabled to view it.. Follow her on Twitter, @ERLarson, or Lake County News, @LakeCoNews.
Eric Jackson, University of Connecticut and Marisa Auguste, University of Connecticut
Although there are fewer cars on America’s roads since the pandemic began, the number of fatal car crashes has increased.
Early nationwide data supports this counterintuitive finding: Although daily trips from households fell by as much as 35% in 2020, preliminary traffic fatality count data for the first nine months of 2020 shows 28,190 people died in motor vehicle traffic crashes - a 4.6% increase compared with the same period in 2019. The same trend has been reported in countries outside the U.S., such as Australia, where less traffic has not produced fewer road deaths.
Curious about traffic crashes during the pandemic, we decided to use our skills as a social scientist and a research engineer who study vehicle crash data to see what we could learn about Connecticut’s traffic deaths when the stay-at-home orders first went into place last March.
A partnership between the Department of Transportation, local hospitals and the University of Connecticut discovered what many people intuitively knew: Traffic volume and multivehicle crashes fell significantly during the stay-at-home order. Statewide, daily vehicle traffic fell by 43% during the stay-at-home order compared to earlier in the year, while mean daily counts of multivehicle crashes decreased from 209 before the stay-at-home order to 80 during lockdown.
What was unexpected, however, was the significant increase in single-vehicle crashes, especially fatal ones. During the stay-at-home period, the incidence rate of fatal single-vehicle crashes increased 4.1 times, while the rate of total single-vehicle crashes was also up significantly.
Data about all crash types in the state, whether single- or multivehicle, tell a similar story. Although preliminary, police reports have placed the 2020 year-end total for traffic deaths at 308, a 24% increase from 2019.
It is unclear exactly why this is happening, but we are using data to investigate a few theories.
Data show that drivers are more likely to be speeding. Although traffic volume on Route 15 and Interstate 95 in Connecticut fell 52% in April 2020, the number of vehicles going more than 80 mph increased by 94%. Other states are seeing the same trends.
Drivers also appear to be very distracted. Data collected by Zendrive, a company that tracks smartphone data to predict drivers’ behavior, shows that in 57% of crashes nationwide in 2020, drivers were on their phones. From January (pre-lockdown) to March 2020, drivers in crashes spent 7% more time on their phones; when that data collection was extended to November, drivers checked their phones 17% more often. These trends are also holding up in other countries.
American drivers are also being riskier on the road: According to the National Highway Traffic Safety Administration, the percentage of injured road users – drivers, pedestrians, bicyclists – with alcohol, marijuana or opioids in their system all increased during the pandemic.
Any death during COVID-19 – whether it’s the direct result of the virus or its indirect effects on daily life – is a tragedy. Yet there are ways to keep drivers safe during this tumultuous period.
In normal conditions, drivers often “go with the flow” of traffic, matching the speed of other cars. Without other cars around, it may be easy to unconsciously go much faster. Frequent speedometer checks can help combat this.
Setting cruise control to the speed limit – or, at most, five mph above – will lock in your speed and save you from having to check the speedometer.
Don’t drive angry
In addition, if you’re upset, try to avoid getting behind the wheel. The COVID-19 pandemic has left many feeling isolated, agitated or simply bored – but people who are feeling aggressive or angry are more likely to engage in unsafe driving. If you’re in a heightened emotional state, ask a friend or family member to drive, use public transit or ride-sharing services, take a walk, ride a bike or simply stay home.
Last, stay focused. With fewer vehicles on the road, it may also seem safer than usual to sneak a peek at your phone. That’s not the case, as the rise in phone use and fatal crashes during 2020 illustrates. To reduce the temptation of checking your phone, many free apps, such as Drivemode and Android Auto, simplify phone functions like GPS and music to minimize distractions.
This article was produced in collaboration with Knowable Magazine, a digital publication covering science and its emerging frontiers.
LAKE COUNTY, Calif. – With the impacts of the COVID-19 pandemic continuing, Mendocino College announced it will continue primarily remote instruction through the summer 2021 semester.
“We are looking forward to transitioning back to more on-ground/face-to-face classes at all locations and plan to see our fall 2021 class schedule reflect that,” said Superintendent and President Tim Karas. “We are happy to report that with the help of Mendocino County, we have been able to provide all interested employees access to the COVID-19 vaccine so they feel comfortable coming back to campus and providing excellent student service as before the pandemic began.”
The college has a “Transition Group” which consists of classified staff, faculty and management leaders brainstorming ways to get more students back on campus in a timely and safe manner.
The college is also surveying students to gather input about how that might look. In the fall 2021 semester, the schedule will offer an expanded on ground/face-to-face course listing.
“We won’t be 100 percent back to normal by fall, but we will be increasing the number of classes at all of our locations,” says Debra Polak, vice president of instruction. “We will be introducing innovative instructional methods in the fall that will allow us to have fewer students in classrooms. We hope some of these new methods will help us reach students in our vast geographic area in post-pandemic times as well.”
“In the fall, the centers in Fort Bragg, Lakeport and Willits will have a heavier on-ground presence to support students who have had a difficult time accessing online education. We plan to offer close to the traditional variety of courses, just with reduced class enrollment caps, that align with current county safety guidelines,” says Dean of Centers Amanda Xu. “The center computer labs will also be open during regular business hours so that our rural students can more efficiently access online courses.”
Since the pandemic began, Mendocino College has continued to expand support and services geared toward student success, including free tutoring, books, tuition and more.
More than half the students who attend Mendocino College qualify for some form of financial aid, and many meet the guidelines that eliminate unit fees completely, regardless of their financial situation.
“There will be numerous opportunities for students to access funds to pay for tuition and other educational expenses in the coming months,” says Karas. “We want students to know that we’re here to help break down any barriers that may be preventing them from returning to school. There is no better time than now to pursue your educational goals.”
Currently enrolled students can register for summer classes using MyMendo beginning April 24 and new students can apply now online at www.mendocino.edu.
The summer 2021 semester officially begins June 7. To make a counseling appointment, please email This email address is being protected from spambots. You need JavaScript enabled to view it..

 How to resolve AdBlock issue?


