LAKE COUNTY, Calif. — An event that teaches students about the importance of agriculture is soon to return.
The fourth Annual Lake County Ag & Natural Resources Day will be held at the Lake County Fairgrounds in Lakeport from 9 a.m. to noon on Wednesday, May 4.
A committee of the Lake County Fair Foundation is hard at work to bring the event’s agricultural and natural resource learning experiences back to Lake County students, in-person.
The event was canceled in both 2020 and 2021 due to the COVID-19 pandemic.
New this year is a second opportunity, Ag & Natural Resources Career Day, which will take place the following week, on Wednesday, May 11, from 9 a.m. to noon.
At the career day event, high school students can learn from local farmers, businesses and educational trade schools about possible career paths. The goal is to showcase the many opportunities in the agriculture and natural resource industries that are located in Lake County.
If you or someone you know would like to support these important events, sponsorship packages are available through the Lake County Fair Foundation, a 501c3 nonprofit organization.
Funds will be used to cover event costs and fund transportation for schools which could otherwise not attend.
Community members, businesses, and service clubs can support the event through sponsorships, exhibits, demonstrations and volunteering efforts.
Preregistration is required and must be submitted by April 8.
Educators should communicate with school administrators to coordinate attendance to either event.
You can learn more about the event at www.lakecountyfairfoundation.com or contact This email address is being protected from spambots. You need JavaScript enabled to view it..
For more information, contact Blair Smith at 209-269-6766 or Sheli Wright at 707-263-6181.
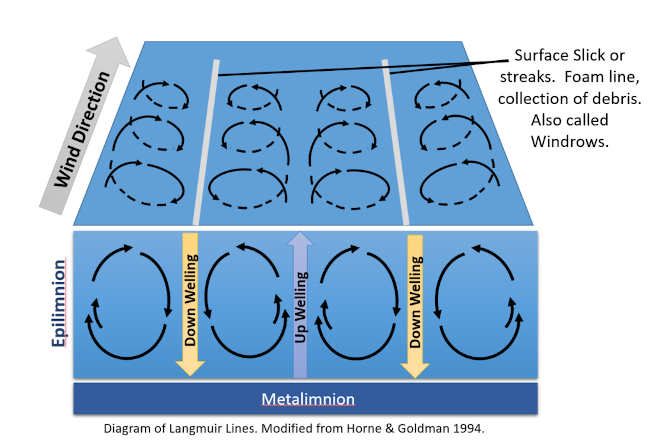
Beautiful example of Langmuir Lines in the Oaks Arm looking towards the Narrows. Photo Credit to Tiffany Peng and Country Air Properties. Dear Lady of the Lake,
Many of our members of our sailing club sometimes see langmuir lines out in Clear Lake. We'd love to hear what you might have to say about them.
Thanks!
— Come Sail with Us at Konocti Bay Sailing Club
Dear Konocti Bay Sailing Club,
Thanks for that question! This is one of my favorite types of questions because as a limnologist I get to share some awesome nerd facts for lake fans! In case you were wondering, a linologist is one who studies limnology, which is the study of fresh inland waters, including the biological, chemical, and physical processes within any fresh waters such as lakes, ponds, wetlands, streams, and creeks. Langmuir lines are physical processes, or phenomena, that occur on large lakes.
Firstly, Langmuir lines or Langmuir circulations (sometimes called “scum, foam, or algae lines”) are surface “lines” that are observed on large lakes and oceans, made up of lines or streaks of foam, sometimes called windrows (pronounced Wind-Rows), that form along the parallel edges of vertical rotating cells. During certain wind conditions, Langmuir lines can exist across large expanses of surfaces on open water, sometimes reaching for miles in very large lakes.
If the above description seemed technical and confusing, don’t worry, I will break down the specific mechanisms that form Langmuir lines in a few paragraphs.
The question about Langmuir lines also has a fascinating answer that involves a description of a physical process that inserts geometry, math, and patterns into nature. Many times we see patterns or shapes in natural systems and it’s always unexpected and amazing to see nature working with straight lines, symmetry, and numerical patterns. Langmuir lines are a prime example of nature being expressed in amazing ways.
OK, first let’s discuss how these striations got the name “Langmuir lines.”
Dr. Irving Langmuir: A physical chemist, limnologist, and science-fiction cultural inspiration
Like most naturally observed phenomena in science and engineering, discoveries made prior to the 1970/1980’s were mostly named after the lead scientist or scientists that “discovered” and described the phenomena in a published record, even if the phenomena had a description prior to that “discovery”. This is called Stigler's law of eponymy.
Many times, physical or mathematical phenomena had pre-existing traditional descriptions, sometimes existing for hundreds or thousands of years before they were “discovered” and given a “new” name. The names and titles we most commonly associate with these observances today were provided by the wave of scientific discovery that came out of the industrialization of the modern western civilizations.
Dr. Irving Langmuir was a physical chemist that did happen to uniquely discover and invent many scientific milestones, due to the advancements in technologies that industrialization made possible. In the case of Langmuir Lines, my research has not revealed any previous descriptions that existed, but of course this is limited to the written or digital record, and I fully recognize and acknowledge that there could be a description and name out there that predates Langmuirs’.
Dr. Irving Lanmuir made an observation of Langmuir Lines during a cross-atlantic journey to England in 1927. He was so intrigued, that when he returned to the States, he spent several years studying Lake George in upstate New York to further understand the mechanics behind what would later be called Langmuir Circulations, or Langmuir Lines.
Dr. Langmuir, a Columbia University engineering graduate, completed his doctorate at University of Göttingen, in Germany. After leaving academia, he worked with General Electric for about 40 years and invented the gas-filled incandescent lamp in 1913. In 1928 he coined the term “plasma” in reference to ionized gasses based on his study of charged particles emitted from filaments. His filament work led to many advances in light bulb technology that made lightbulbs in the first half of the 1900’s more efficient, more affordable, and longer-lasting.
Dr. Langmuir was awarded the Nobel Prize in Chemistry in 1932 and his contributions to surface chemistry were so significant that the American Chemical Society named its Journal of Surface Chemistry and Colloids, Langmuir, after Dr. Irving Langmuir himself.
Kurt Vonnegut’s science fiction novel Cat’s Cradle, published a few years after Langmuir’s death, paid homage to the scientist. Apparently, the main physicist in the novel is a nobel laureate whose life shares parallels to that of Langmuir. We will never know if Irving appreciated the comparison, especially in the context of the novel’s theme, but for the world, Lagmuir’s reach and influence was significant and broad and that is the best any scientist can hope and wish for.
Deep water + Wind = Surface Water Movement or Langmuir Circulation
To understand the movement of surface water that forms Langmuir Lines, you should first be aware that lakes and oceans have layers throughout the water column. Think of a sandwich with a top, middle, and bottom layer - but each layer has its own characteristics based on light, temperature, and movement.
The top layer, called the Epilimnion, is the surface layer and the water here is the warmest (when there is no ice cover) and most active with movement, from wind and surface currents. The layer at the very bottom of a lake or ocean, is very quiet, still, dark, and cold, and called the Hypolimnion.
The layer between the top and bottom layer is called the Metalimnion, and this layer is usually the largest layer, and shares some qualities of both layers. Usually the metalimnion is warmer than the hypolimnion, but colder than the epilimnion. One thing about the metalimnion is that it’s usually really stable and does not contain much movement unless it’s being acted upon by the top or bottom layer. For example the metalminon might mix thoroughly with both layers during seasonal change, when the surface layer gets really cold and dense and sinks to the bottom.
When the lake layers are not mixing, and in their stable states, this is called lake stratification. Langmuir lines do not occur when mixing is occurring and only occur when the lake is stratified. That is because the water movement that occurs in the epilimnion is isolated, think of the atmosphere and the metalimnion being a top and bottom to the surface zone, epilimnion, of the lake or ocean.
High winds blowing in one consistent direction can cause Langmuir lines, but the wind has to be strong (greater than 11 mph or 10 knots) but not so strong that large surface waves form, which can obscure or disrupt the Langmuir line formations. The water current, if there is one, also has to be going in the same direction as the wind as cross currents will prohibit the rotations. Langmuir lines are more commonly observed in deep water bodies, although more studies being conducted in tropical lake systems are observing Langmuir circulations under certain conditions in shallow water bodies.
The wind moves the water sideways to the wind, either left or right, but in alternating directions, creating upwellings and downwellings in an alternating pattern. Think of corkscrews lined up next to each other but going in opposite directions. These are called vertical rotating cells, sandwiched between the surface of the water and the bottom of the epilimnion. The cells do not extend into the metalminon, in fact the middle layer of water acts like a hard surface, binding downward extrent of the vertical rotating cells.
So think of these rows of alternating spirals of water going in opposite directions; and we can easily see how foam, plants, trash, or other debris can get pushed into the parallel lines formed between the cells at the surface of the water. The collection of materials, between the cells, creates the appearance of straight, parallel, streaks on the surface of the water, and hence Langmuir lines.
Since Langmuir’s observation and description of his self-titled circulations, many physicists and limnologists have studied langmuir lines in great detail, and have been able to further explain their occurrence, shapes, flows, and the specific conditions that drive them to form and disappear. Most of these investigations have been possible through what are called “tracer studies”, where traceable or tagged particles are dropped in the water during an occurring Langmuir circulation and the movements can be further understood and described.
More visual details and information about the additional contribution to langmuir lines are summarized in this great video on the SciencePrimer youtube channel called “What are those streaks on the water? - Langmuir Circulation."
Again, thanks for the question Konocti Bay Sailing Club, and I will leave you with a wonderful quote by Dr. Dori Lal from her 2015 paper in the publication called The Signage. Langmuir lines are a perfect example of the “beauty of nature as revealed by geometry and the beauty of geometry as revealed in nature”.
Sincerely,
Lady of the Lake
Angela De Palma-Dow is a limnologist (limnology = study of fresh inland waters) who lives and works in Lake County. Born in Northern California, she has a Master of Science from Michigan State University. She is a Certified Lake Manager from the North American Lake Management Society, or NALMS, and she is the current president/chair of the California chapter of the Society for Freshwater Science. She can be reached at This email address is being protected from spambots. You need JavaScript enabled to view it.. You can now hear from the Lady on the Lake on local radio, KPFZ 88.1, the last Sunday of every month, during the “Lake County Fire Recovery” and “What’s Next” weekly shows between 2 and 4 p.m.
This image shows the average concentration of Arctic sea ice on Feb. 25, 2022. The yellow outline shows the median sea ice extent for the month of March, when the ice generally reaches its maximum extent, as observed by satellites from 1981 to 2010. A median is the middle value. That is, half of the extents were larger than the line, and half were smaller. Credits: Joshua Stevens/NASA Earth Observatory. Arctic sea ice appeared to have hit its annual maximum extent on Feb. 25 after growing through the fall and winter.
This year’s wintertime extent is the 10th-lowest in the satellite record maintained by the National Snow and Ice Data Center, one of NASA’s Distributed Active Archive Centers.
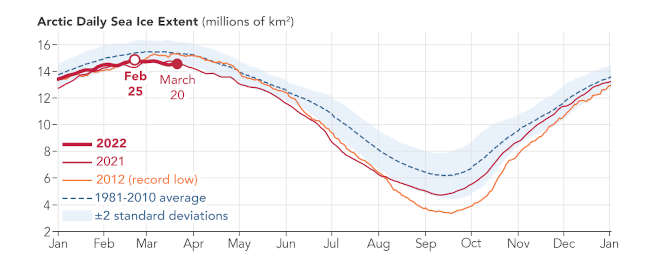
Arctic sea ice extent peaked at 5.75 million square miles and is roughly 297,300 square miles below the 1981-2010 average maximum — equivalent to missing an area of ice slightly larger than Texas and Maine combined. This maximum ties with 2015 as the third earliest on record.
Sea ice waxes and wanes with the seasons every year. In the Arctic, it reaches its maximum extent around March after growing through the colder months, and shrinks to its minimum extent in September after melting through the warmer months. In the Southern Hemisphere, Antarctic sea ice follows an opposite cycle.
To estimate sea ice extent, satellite sensors gather sea ice data that are processed into daily images, each image grid cell spanning an area of roughly 15 miles by 15 miles (25 kilometers by 25 kilometers). Scientists then use these images to estimate the extent of the ocean where sea ice covers at least 15% of the water.
Since satellites began reliably tracking sea ice in 1979, maximum extents in the Arctic have declined at a pace of about 13% per decade, with minimum extents declining at about 2.7% per decade.
These trends are linked to warming caused by human activities such as emitting carbon dioxide, which traps heat in the atmosphere and causes temperatures to rise. NASA’s analysis also shows the Arctic is warming about three times faster than other regions.
This February, Antarctic sea ice dropped to a record-low minimum extent. But unlike in the Arctic, this sea ice has shown irregular ups and downs mainly because of the geographical features that surround it. Winds and ocean currents specifically linked to the Southern Ocean and Antarctica have a strong influence on sea ice extent.
Sea ice in the Arctic is surrounded by land, whereas sea ice in the Antarctic is surrounded only by ocean and can thus spread out more freely. Overall, the Antarctic sea ice record shows a slightly upward — but nearly flat — trend or increase.
Gains in Antarctic sea ice are not large enough to offset the losses of the Arctic. The ice in both regions helps regulate global temperatures. Even if Antarctic gains balanced sea ice levels globally, Arctic sea ice losses could still contribute to further regional and global warming.
Roberto Molar Candanosa works for NASA’s Goddard Space Flight Center in Greenbelt, Maryland.
This graph shows Arctic daily sea ice extent in 2022, 2021, and 2012 compared to the 1981-2010 average. This year’s annual maximum extent was reached on Feb. 25. Credits: Joshua Stevens/NASA Earth Observatory
LAKEPORT, Calif. — Prospective students recently were able to participate in an event at the Mendocino College Lake Center that introduced them to the campus and educational opportunities there.
On Thursday, March 17, the Mendocino College Lake Center hosted its first campus event in over two years.
Nearly 200 students from Kelseyville High School, Clear Lake High School, Upper Lake High School, Terrace Middle School and Mountain Vista Middle School were able to attend College Day to explore the Lakeport campus while meeting with college staff and faculty representing a variety of support services and educational programs.
The focus of the event was to provide potential incoming college students with information about the many career paths possible through an education at Mendocino College.
“It was invigorating to see our local Lake County students discover options for their future they did not know existed,” says Dean of Centers Amanda Xu. “The Lake Center is proud to be a resource to promote their higher education and career goals.”
Student Service programs in attendance included the Mendocino College Foundation, CalFresh outreach, tutoring, MESA, transfer counseling, disability resources, student equity, Native American student resources, Lake Family Resource Center, CAMP, Financial Aid, and EOPS. Academic departments included: Administration of Justice, Automotive, Child Development, English as a Second Language, English, Digital Arts and Media, Photography/Recording Arts, Athletics, Computer Science, Fire Science, Emergency Medical Services, Nursing, Theater, and Communications.
The college thanked the Lakeport Kiwanis group, who sponsored lunch for all student attendees.
Upcoming events at the Mendocino College centers include College Day at the Mendocino College North County Center in Willits on Thursday, March 31; the Registration Fiesta at the Mendocino College Lake Center in Lakeport on Thursday, May 12; and the Job Fair and Registration Fiesta at the Mendocino College Coast Center in Fort Bragg on Friday, May 13.
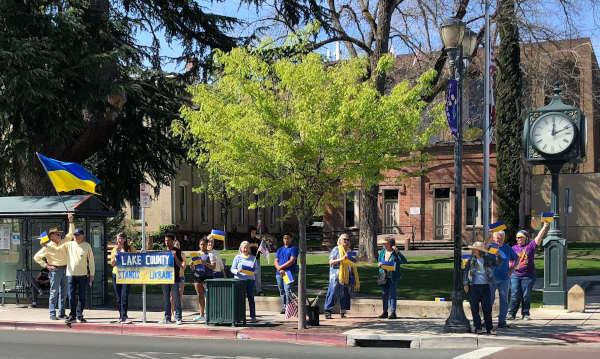
Community members gathered in Lakeport, California, to show support for Ukraine in response to President Volodymyr Zelenskyy’s request on Saturday, March 26, 2022. Photo courtesy of Deb Baumann. LAKEPORT, Calif. — Lake County answered the call from President Volodymyr Zelenskyy, who asked communities across the world to "come out of your offices" and homes and to gather "in your public squares" to show support for Ukraine.
On Saturday in Library Park in Lakeport, Lake County residents did just that.
Lakeport City Councilmember Michael Green handed out small Ukrainian flags to participants and distributed them to shops up and down main street.
People brought banners and a big Ukrainian flag which was waved to approve honks from drivers on Main Street.
It has been a full month since Russia invaded on Feb. 24. What was expected to be a rapid victory for Russia has turned into a stalemate as Ukrainian fighting forces and citizen volunteers have brought the giant Russian juggernaut to a standstill.
“The courage and resistance of the Ukrainian people has inspired the world,” said Deb Baumann of Upper Lake, one of the event’s organizers.
Baumann said people came from all over Lake County to show support.
Participants at a rally in support of Ukraine lined Main Street in Lakeport, California, on Saturday, March 26, 2022. Photo courtesy of Deb Baumann.
LAKE COUNTY, Calif. — A Friday report showed that California created 20% of the nation’s jobs in February while decreasing the unemployment rate, with Lake County also showing a drop in joblessness and reporting hundreds of new jobs.
The state’s unemployment rate for February was 5.4%, down from the revised rate of 5.7% in January, with employers adding 138,100 nonfarm payroll jobs to the economy, according to data released by the California Employment Development Department.
The Employment Development Department said California’s 138,100 new jobs in February far outpaced every other state, and it was 60,300 more jobs than the next closest state of Texas and 87,100 more jobs than Florida.
The federal Bureau of Labor Statistics said the nationwide jobless rate in February was 3.8%, down from 4% in January and 6.2% in February 2021.
In Lake County in February, the jobless rate was 5.9%, down from an adjusted rate of 6.8% in January, according to the data. The February 2021 rate was 9.2%.
In February, almost all of Lake County’s job sectors added jobs, led by total farm, which was up by 39.4% percent, or 260 jobs, followed by a 12.5% increase in the information sector and 11.1% for wholesale trade.
Overall, Lake County added 430 jobs in February, the Employment Development Department reported.
California has now regained 87.2% — or 2,405,900 — of the 2,758,900 nonfarm jobs lost during March and April of 2020 due to the COVID-19 pandemic.
Since January 2021, California has created more than 1.3 million jobs, the state reported.
“These latest numbers show that California is continuing to drive our nation’s job growth,” said Gov. Gavin Newsom. “We’re doing it by promoting more pathways to opportunity and embracing the diversity, creativity, innovation, and determination that breeds success — building a California for all.”
Of the 678,000 jobs the nation gained in February, California accounted for 20.4% of them. The state’s year-over job growth of 6.8% also outpaced the nation’s rate of 4.6%.
The report showed that California has enjoyed month-over gains in nonfarm jobs in 12 of the past 13 months, averaging roughly 101,700 jobs gained per month over that time.
Email Elizabeth Larson at This email address is being protected from spambots. You need JavaScript enabled to view it.. Follow her on Twitter, @ERLarson, or Lake County News, @LakeCoNews.
BERKELEY, Calif. — For someone who admits to "childlike excitement" at the prospect of a snowstorm, Andrew Schwartz has the perfect job.
He's the new manager of the University of California, Berkeley's Central Sierra Snow Laboratory, or CSSL, the only continuously manned snow research outpost in the Western U.S.
He arrived there last April, and so far, he's loving it. His first season in the 75-year-old U.S. Forest Service building — both a lab and a home for him, his wife and two dogs — in Soda Springs, California, saw the second highest October snowfall ever in the Sierra Nevada and the highest snowfall for any December in recorded history.
That was good news at the onset of winter, Schwartz said, but the so-called "whiplash weather" that has become normal in California — unusually dry months followed by abnormally wet months — makes forecasting the season's snowpack highly uncertain.
A lightly dusted January was followed by a nearly dry February, which ended with a 16-inch dump of new snow three weeks ago. Less than 10 inches of snow has fallen since, and predictions are for a drier than normal spring — again.
Because the size of the snowpack determines the water flow into the state's rivers, streams and reservoirs in the spring — and the water available for agriculture, fish, industry and homes — runoff predictions also are highly uncertain.
That means that daily records from CSSL and monthly snow-depth measurements at many other sites in the Sierra Nevada are critical for state and federal water managers who monitor and plan water usage across the West and in California.
"The site is kind of unique in that there's a lot of the same measurements being made with multiple different instruments," Schwartz said. "The benefit of having us up here is that during storms, we continue manual measurements. There still isn't really a unified way of accurately measuring new snowfall, so the best way that we really have is to go out and put a pole in the middle of it and measure it by hand with rulers."
The intermittently snowy conditions so far this season are perfect for the revitalized role of the lab, which includes testing low-cost, 3D-printed snow depth sensors — prototypes created for water managers in developing countries by the 3D-Printed Automatic Weather Station, or 3D-PAWS, initiative at the University Corporation for Atmospheric Research in Boulder, Colorado — and testing new instrumentation for the California Department of Water Resources. These projects help maintain the lab's prominence in snow science, he said.
"The snow lab was the pinnacle of snow science for a very long time, and still is, for a large portion of California," Schwartz said, noting that the lab sits in one of snowiest places in the U.S. "Snow science is more important than it's ever been, especially in the West, where snow contributes so much to our water resources."
The lab has an unparalleled record, going back more than 75 years, of daily or even hourly temperature, snowfall and snowpack measurements. While there are several hundred automated snow and precipitation stations throughout the Sierra Nevada, only CSSL has a snow scientist on site to cross-check measurements — there are four different instruments in Schwartz's backyard that measure precipitation — and provide a measure of the water content in the snow every two to three days.
"We have those long records to look at over the last 75-odd years to really try to determine what the current trends in temperature and precipitation are, compared to some of those stations that might only have a few years of data," he said.
Snow Lab Hill
Situated on Forest Service land on what locals call Snow Lab Hill, at an elevation of 6,894 feet in Soda Springs, an unincorporated community 10 miles from Truckee, the lab has been a vital, but sometimes mysterious, gem.
Schwartz plans to increase its visibility, with outreach to the community and schools and, by making all the snow and precipitation data available online, to the whole world.
One idea he hopes to realize is a simple and inexpensive snow sensor that could become a backyard staple for citizen scientists interested in local snow conditions. It would be somewhat like the 3D-PAWS device, which emits a sound pulse downward toward the snow and measures the time it takes for the reflected pulse to return, which gives the height of the snowpack.
The device Schwartz is working on can be mounted outdoors and linked to the internet via Wi-Fi in a dense network of sensors, much like the popular PurpleAir network of air quality sensors that has become vital to Westerners during the ever-expanding wildfire season.
"I have been thinking about this citizen science project for the last three years," he said. "Thousands or tens of thousands of sensors, most in mountainous regions, would be a big increase in the number of data points, giving us a better idea of how much water is up here in the snowpack and also allow for better quality control of our instruments. It would bulk up the data available to DWR and be science for everyone."
Tasked by DWR with testing new instrumentation and training its staff how to use it, Schwartz is making the snow lab indispensable to the agency, which manages and allocates water throughout the state.
The lab has always been an important asset to California, because of its continuous records of snow and rain precipitation and temperature going back to the lab's founding in 1946. With the addition of Southern Pacific Railroad data, the snow lab can see trends in snowfall back to 1879.
"The benefit of having this long record is we can see the trends that are starting to emerge from things like climate change," Schwartz said. "For example, the lab has seen an increase in overall precipitation, but a decrease in snow. With that, it's going to make managing the water that comes out of the snow pack a little bit more challenging."
Sierra snowpack is like a water tower
As Schwartz explains it, "The snowpack is effectively a water tower that sits up on top of the mountain and allows stored water to slowly trickle into reservoirs and streams."
With more rain and less snow, the water more quickly enters the reservoirs and streams and more quickly evaporates or gets whisked downstream into the ocean. That means less water during the summer for agriculture, home and urban use, and for fish.
When the lab was built, it was one of three outdoor snow labs in the montane West, that were joint projects between the U.S. Weather Bureau and the U.S. Army Corps of Engineers to understand the water and hydrology of the Rocky Mountains, Cascade Range and Sierra Nevada.
It is the only one that has survived. It eventually reverted to the U.S. Forest Service, which operated it from 1954 to 1995, when the U.S. Department of Agriculture, or USDA, shut it down and its seven full-time employees either retired or were reassigned. Luckily for the long-term snow record in the Sierra, UC Berkeley stepped in to keep it open, but with only one staff member, Randall Osterhuber, who retired in 2019.
Luck again stepped in. Robert Rhew, UC Berkeley associate professor of geography and faculty director of the campus's Central Sierra field stations, sought input about the lab's value from many of the agencies that have relied on CSSL data or even built instruments on site — DWR, the National Weather Service, the USDA's Natural Resource Conservation Service, UC Davis, the University of Nevada, Reno, and the Desert Research Institute, among others.
"Each group extolled the importance of continuing Snow Lab operations, which ultimately convinced the university to allow a new station manager to be recruited," Rhew said.
Schwartz saw the job notice as he was finishing his doctorate in atmospheric science at the University of Queensland, Australia, where he wrote his thesis on the effects of bushfires, or wildfires, on the snowpack — ironically, while looking out his window at palm trees and learning to surf. He was excited, but his wife, Megan, even more so. He applied and was snapped up.
Born and raised in Denver, Schwarz said that he always loved playing in the snow — hence, his excitement at impending blizzards.
He chose to study meteorology at the Metropolitan State University of Denver while interning at the National Center for Atmospheric Research, or NCAR, in Boulder, where he focused on the impacts of winter weather on airports and plane deicing, or keeping planes free of ice. Upon graduation, he became an associate scientist at NCAR before applying to graduate school and shifting his focus to the impact of fires on the snowpack.
"Fire alters the characteristics of the watershed — it removes trees, allowing greater sun exposure that melts snow, and the char on the trees falls on the snow and soaks up more sunlight, causing faster melt," he said. "All of this can affect the timing of water coming out of the snowpack."
Schwarz’s work on wildfires and snowpacks undoubtedly helped him get the CSSL job, but so did his expertise fixing equipment and his willingness to do the mundane maintenance required at every field station.
When his family moved in after the lab had been empty for 18 months, he had to clean out spiders, mice, ground squirrels and all the drains.
He picked up a well-used SnowCat in Sacramento and an old, but mildly used, snowmobile through Craig's List, both of them necessary for getting up Bunny Hill Road in the winter and checking snow levels at another UC Berkeley field station, Onion Creek Experimental Forest, about 8 miles west of the CSSL.
He and his wife don't claim that life is easy. The December storms left them without power for several days around Christmas, and any storm could keep them homebound for days, if not weeks.
But local activities — snowboarding, snowmobiling and snowshoeing in the winter, mountain biking and kayaking on Lake Tahoe in the summer — provide a welcome break from snow science.
Improvements to the lab are coming, however. The main building is due for an extensive renovation, perhaps this summer, and money from DWR is helping to upgrade the scientific instruments and consolidate them on a platform high off the ground, with new power and Internet cables.
This will help with new collaborations, both on campus, around the UC system and with other California, Nevada and federal agencies, and, ideally, allow undergraduates to visit the lab for research purposes.
"It's great to be working at a place on the cusp of water resources in California at such a pertinent time," he said.
Robert Sanders writes for the UC Berkeley News Center.
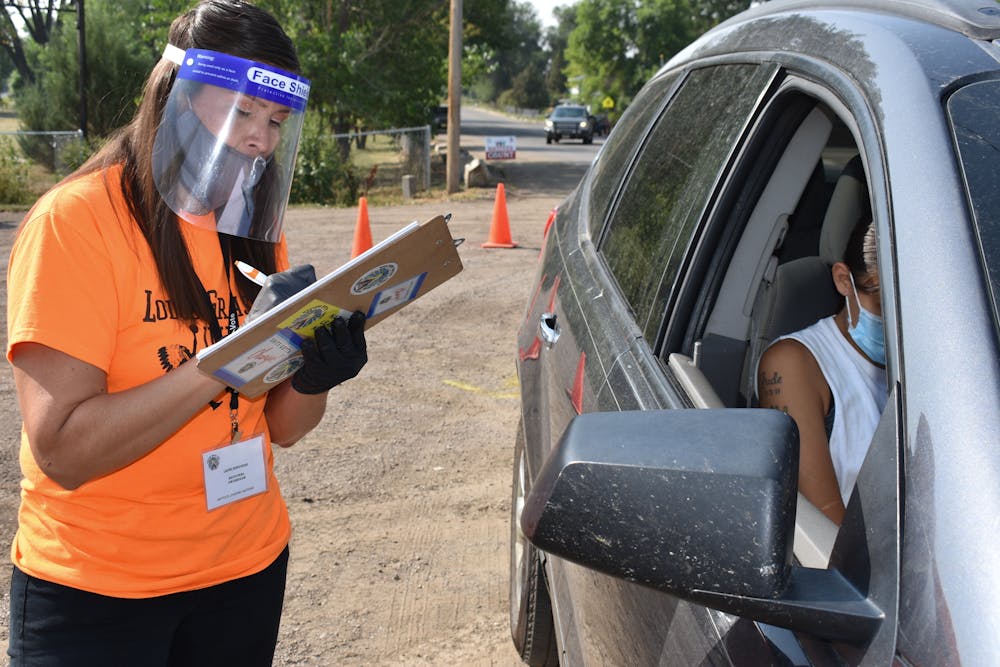
Census takers went door to door in 2020, as in past years, seeking to make the count as accurate as possible. AP Photo/John Raoux
The census conducted in the U.S. every 10 years is meant to count everyone. But it doesn’t actually count everyone.
After every census, the U.S. Census Bureau reports how well it did at counting every person in the country. In 2020, as in past years, the census didn’t get a completely accurate count, according to the bureau’s own reporting. The official census number reported more non-Hispanic whites and people of Asian backgrounds in the U.S. than there actually were. And it reported too few Blacks, Hispanics and Native Americans who live on reservations.
The Conversation U.S. asked Aggie Yellow Horse, a sociologist and demographer at Arizona State University, to explain why, and how, the census misses people, and how it’s possible to assess who wasn’t counted._
Census workers found their time and ability to connect with people limited by the pandemic.AP Photo/Matthew Brown
1. Who gets missed in the census?
The people most commonly missed are those with low income, people who rent or don’t have homes at all, people who live in rural areas and people who don’t speak or read English well. Often, these are people of color – Black Americans; Indigenous peoples; or people of Hispanic, Asian or Pacific Islander backgrounds.
However, the pandemic made that process more difficult for the 2020 census, both by making people uncomfortable with in-person visits and by shortening the timeline for collecting the data.
2. Who got missed?
The official estimates show that the 2020 census was really very accurate, capturing 99.8% of the nation’s residents overall. But the census missed counting 3.3% of Black Americans, 5.6% of American Indians or Alaskan Natives who live on reservations and 5% of people of Hispanic or Latino origin. This could mean missing about 1.4 million Black Americans; 49,000 American Indians or Alaskan Natives who live on reservations; and 3.3 million people of Hispanic or Latino origin.
This performance is much worse than in the previous two censuses, when smaller proportions of those populations were missed.
The 2020 census also counted 1.64% more non-Hispanic whites than there actually are in the country. For example, college students could have been counted twice – at their college residence and at their parents’ home.
3. How can they count the people who were missed?
It can be puzzling to understand how the Census Bureau can know how many people it missed. Efforts for measuring census accuracy started in 1940. Census officials use two methods.
First, the Census Bureau uses demographic analysis to create an estimate of the population. That means the bureau calculates how many people might be added to the population counts, through birth registrations and immigration records, and how many people might be removed from them, through death record or emigration reports. Comparing that estimate with the actual count can reveal an overall scale of how many people the census missed.
As a second measure, the Census Bureau runs what it calls a “post-enumeration survey,” taken after the initial census data is collected. The survey is conducted independent of the census and randomly sent to a small group of households from census blocks in each state, the District of Columbia and Puerto Rico. The results of that survey are compared with the census results for those households and can reveal how many people were missed, or if some people were counted twice or counted in the wrong place.
Population figures formally reported by the Census Bureau for the purposes of reapportionment cannot be corrected, according to a 1999 Supreme Court ruling.AP Photo/Jeffrey Collins
4. Can the Census Bureau fix its data?
The Census Bureau has determined that its 2020 data is not accurate and has measured the amount of that inaccuracy. But in 1999, the Supreme Court ruled that the bureau cannot adjust the numbers it sent to Congress and the states for the purpose of allocating seats in the U.S. House of Representatives and, therefore, Electoral College votes. That’s because federal law bars the use of statistical sampling in apportionment decisions and requires those changes to be made only on the basis of how many people were actually counted. That means political representation in Congress may not accurately reflect the constituencies the representatives serve.
This approach can lessen the harm done to communities where the census count missed people. But it doesn’t prevent the Census Bureau from missing them – or others – in the next census.
LAKE COUNTY, Calif. — Lake County’s Konocti Christian Academy is gearing up to host its 15th annual Lake County Renaissance Faire fundraiser.
The event will take place on Saturday, May 7, from 9 a.m. to 4 p.m. at the Lake County Fairgrounds.
The faire takes a walk back in time to the Renaissance era with costume, theater, games, activities, food and song. Guests will enjoy Shakespearean plays presented by nearly 100 KCA students.
“Each year our children and faculty pour a great deal of love and effort into planning the Renaissance Faire Fundraiser. The event has become a great point of pride for our school, and we are excited to share it again with our community,” KCA Principal Meredith Wiser explained.
The Renaissance Faire fundraiser includes music, live and silent auction, booths, feasting fit for a king, activities for the entire family, live performances and so much more.
Ticket prices range from $10 to $45 and sponsorships are available. To purchase tickets, become a sponsor or to make a donation, visit Eventbrite, KCA’s Facebook page, or at KCA by calling 707-262-1522.
Konocti Christian Academy is a 501(c)(3) non-profit and donations are tax-deductible.
More than 73% — or 2,297 — of U.S. counties experienced natural decrease in 2021, up from 45.5% in 2019 and 55.5% in 2020, according to the newly released U.S. Census Bureau’s Vintage 2021 estimates of population and components of change.
Natural decrease occurs when there are more deaths than births in a population over a given time period. In 2021, fewer births, an aging population and increased mortality – intensified by the COVID-19 pandemic — contributed to a rise in natural decrease.
The statistics released today include population estimates and components of change for the nation’s 384 metropolitan statistical areas, 543 micropolitan statistical areas and 3,143 counties.
In 2021, all counties in Delaware, Maine, New Hampshire and Rhode Island experienced natural decrease.
Some counties also experienced population declines attributable to migration. Counties with net international migration loss (more people moving out of than into the country), were most frequently found in California (41.4%), Oregon (27.8%) and Mississippi (23.2%). States with the highest percentages of counties with net domestic migration loss (people moving from one area to another within the United States) were Alaska (80.0%), Louisiana (71.9%) and Illinois (65.7%).
Most of the nation’s counties – 2,063 or 65.6% — experienced positive domestic migration overall from 2020 to 2021. Arizona’s Maricopa County gained the most (46,866) residents from domestic migration, followed by Riverside County, California (31,251), and Collin County, Texas (30,191). Los Angeles County, California, experienced the greatest net domestic migration loss (179,757 residents), followed by New York County, New York (113,642).
“The patterns we’ve observed in domestic migration shifted in 2021,” said Dr. Christine Hartley, assistant division chief for estimates and projections in the Census Bureau’s Population Division. “Even though over time we’ve seen a higher number of counties with natural decrease and net international migration continuing to decline, in the past year, the contribution of domestic migration counteracted these trends so there were actually more counties growing than losing population.”
In many cases, there was a shift from larger, more populous counties to medium and smaller ones. These patterns contributed to population increases in 1,822 counties (58.0%), while 1,313 (41.8%) lost residents, and eight (0.3%) saw no change in population.
U.S. micro areas, up 0.2% between 2020 and 2021, grew slightly faster than U.S. metro areas, which increased by 0.1%. This is a departure from past trends when metro areas typically grew at a faster rate than micro areas.
Among metro areas, 251 (65%) experienced population increases between 2020 and 2021. Of the 543 U.S. micro areas, 287 (52.9%) had population increases in 2021.
Of the 384 metro areas in the 50 states and District of Columbia, 213 (55.5%) experienced natural decrease in 2021, with Pittsburgh, PA (-10,838); Tampa-St. Petersburg-Clearwater, FL (-9,291); and North Port-Sarasota-Bradenton, FL (-6,643) having the highest levels.
Sixty-three percent of metro areas had positive net domestic migration, with Phoenix-Mesa-Chandler, AZ (66,850); Dallas-Fort Worth-Arlington, TX (54,319); and Tampa-St. Petersburg-Clearwater, FL (42,089) seeing the largest net domestic migration gains.
The largest metropolitan net domestic migration losses were in New York-Newark-Jersey City, NY-NJ-PA (385,455); Los Angeles-Long Beach-Anaheim, CA (204,776); San Francisco-Oakland-Berkeley, CA (128,870); and Chicago-Naperville-Elgin, IL-IN-WI (106,897).
LAKE COUNTY, Calif. — Lake County Animal Care and Control has many dogs of all ages waiting to get their new start with a loving family.
Dogs available for adoption this week include mixes of Anatolian shepherd, Australian cattle dog, Australian Kelpie, border collie, German shepherd, Great Pyrenees, husky, Labrador retriever, shepherd and pit bull.
Dogs that are adopted from Lake County Animal Care and Control are either neutered or spayed, microchipped and, if old enough, given a rabies shot and county license before being released to their new owner. License fees do not apply to residents of the cities of Lakeport or Clearlake.
The following dogs at the Lake County Animal Care and Control shelter have been cleared for adoption.
Call Lake County Animal Care and Control at 707-263-0278 or visit the shelter online for information on visiting or adopting.
This 1-year-old male pit bull terrier is in kennel No. 7, ID No. LCAC-A-2821. Photo courtesy of Lake County Animal Care and Control. Male pit bull terrier
This 1-year-old male pit bull terrier has a short white and tan coat.
He is in kennel No. 7, ID No. LCAC-A-2821.
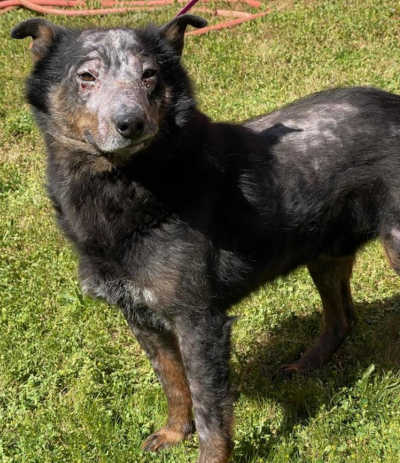
This 7-year-old female shepherd mix is in kennel No. 10, ID No. LCAC-A-2792. Photo courtesy of Lake County Animal Care and Control. Female shepherd mix
This 7-year-old female shepherd mix has a tricolor coat.
She was in kennel No. 10, ID No. LCAC-A-2792.
“Jingo” is a 3-year-old male Labrador retriever in kennel No. 12, ID No. LCAC-A-2636. Photo courtesy of Lake County Animal Care and Control. ‘Jingo’
“Jingo” is a 3-year-old male Labrador retriever with a short black coat.
He is in kennel No. 12, ID No. LCAC-A-2636.
This 4-year-old female Labrador retriever is in kennel No. 14, ID No. LCAC-A-2694. Photo courtesy of Lake County Animal Care and Control. Female Labrador retriever
This 4-year-old female Labrador retriever has a short black coat.
She is in kennel No. 14, ID No. LCAC-A-2694.
This 3-year-old male Australian cattle dog is in kennel No. 16, ID No. LCAC-A-3131. Photo courtesy of Lake County Animal Care and Control. Australian cattle dog
This 3-year-old male Australian cattle dog has a black coat with tan markings.
He is in kennel No. 16, ID No. LCAC-A-3131.
This young male border collie is in kennel No. 17, ID No. LCAC-A-3207. Photo courtesy of Lake County Animal Care and Control. Male border collie
This young male border collie has a short black and white coat.
He is in kennel No. 17, ID No. LCAC-A-3207.
“Max” is a 4-year-old male Australian Kelpie mix in kennel No. 18, ID No. LCAC-A-2852. Photo courtesy of Lake County Animal Care and Control. ‘Max’
“Max” is a 4-year-old male Australian Kelpie mix with a black and tan coat with white markings.
She is in kennel No. 18, ID No. LCAC-A-2852.
This 2-year-old female German shepherd is in kennel No. 19, ID No. LCAC-A-2844. Photo courtesy of Lake County Animal Care and Control. Female German shepherd
This 2-year-old female German shepherd has a black coat.
She is in kennel No. 19, ID No. LCAC-A-2844.
This 1-year-old female shepherd mix is in kennel No. 20, ID No. LCAC-A-2843. Photo courtesy of Lake County Animal Care and Control. Female shepherd mix
This 1-year-old female shepherd mix has a short tricolor coat.
She is in kennel No. 20, ID No. LCAC-A-2843.
This 3-year-old male pit bull terrier is in kennel No. 21, ID No. LCAC-A-2948. Photo courtesy of Lake County Animal Care and Control. Male pit bull terrier
This 3-year-old male pit bull terrier has a short tan and white coat.
He is in kennel No. 21, ID No. LCAC-A-2948.
“Kimber” is a 1-year-old female pit bull terrier in kennel No. 22, ID No. LCAC-A-2957. Photo courtesy of Lake County Animal Care and Control. ‘Kimber’
“Kimber” is a 1-year-old female pit bull terrier with a short red and white coat.
She is in kennel No. 22, ID No. LCAC-A-2957.
“Barney” is a 3-year-old male retriever in kennel No. 23, ID No. LCAC-A-2856. Photo courtesy of Lake County Animal Care and Control. ‘Barney’
“Barney” is a 3-year-old male retriever with a brown and black coat with white markings.
He is in kennel No. 23, ID No. LCAC-A-2856.
“Blue” is a 4-year-old female husky in kennel No. 25, ID No. LCAC-A-2816. Photo courtesy of Lake County Animal Care and Control. ‘Blue’
“Blue” is a 4-year-old female husky with a gray and white coat, and blue eyes.
She is in kennel No. 25, ID No. LCAC-A-2816.
This 2-year-old male Anatolian shepherd-Great Pyrenees is in kennel No. 26, ID No. LCAC-A-2536. Photo courtesy of Lake County Animal Care and Control. Anatolian shepherd-Great Pyrenees
This 2-year-old male Anatolian shepherd-Great Pyrenees has a short white coat.
He is in kennel No. 26, ID No. LCAC-A-2536.
This young female border collie mix is in kennel No. 27, ID No. LCAC-A-3209. Photo courtesy of Lake County Animal Care and Control. Female border collie
This young female border collie mix has a short brindle and white coat.
She is in kennel No. 27, ID No. LCAC-A-3209.
This male Doberman pinscher mix puppy is in kennel No. 31, ID No. LCAC-A-3210. Photo courtesy of Lake County Animal Care and Control. Male Doberman pinscher mix pup
This male Doberman pinscher mix puppy has a short tan coat.
He is in kennel No. 31, ID No. LCAC-A-3210.
This 2-year-old female pit bull terrier is in kennel No. 33, ID No. LCAC-A-3085. Photo courtesy of Lake County Animal Care and Control. Female pit bull terrier
This 2-year-old female pit bull terrier has a short black and white coat.
She is in kennel No. 33, ID No. LCAC-A-3085.
This 3-year-old male Australian cattle dog is in kennel No. 34, ID No. LCAC-A-3130. Photo courtesy of Lake County Animal Care and Control. Male Australian cattle dog
This 3-year-old male Australian cattle dog has a short black, tan and white coat.
He is in kennel No. 34, ID No. LCAC-A-3130.
Email Elizabeth Larson at This email address is being protected from spambots. You need JavaScript enabled to view it.. Follow her on Twitter, @ERLarson, or Lake County News, @LakeCoNews.
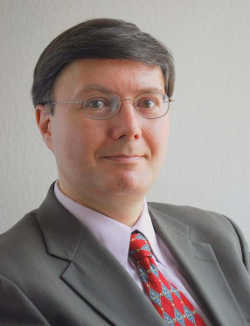
Dennis Fordham. Courtesy photo. An attorney owes the duties of competence, communication, confidentiality, loyalty and nondiscrimination to a client.
These duties require special attention and care by the attorney when representing clients with diminished capacity.
Recently the California State Bar issued formal Opinion No. 2021-207 (the “Opinion”) to examine four ethics issues when an attorney represents a client with diminished capacity.
First, “a lawyer has a duty to maintain, insofar as reasonably possible, a normal attorney-client relationship, as reflected in the rules relating to competence, communication, confidentiality, loyalty and nondiscrimination.”
A lawyer must first apply the presumption that the client has capacity to engage in the legal activity.
Capacity is evaluated on a “decision by decision basis” and the lawyer’s duty of competence may require the lawyer “taking measures to enhance the client’s ability to make and communicate an effective decision.”
Some decisions require more capacity than other decisions.
For example, “the attorney may adjust the interview environment, communicate more slowly, spend more time, and meet the client when he or she is more lucid.” The attorney may have the client’s trusted family members help the client’s communication and understanding.
Nonetheless, the client must still have sufficient capacity. Even with support a lawyer must recognize that, “ … the client may be unable to make a legally effective decision, …, or that diminished capacity will result in a decision that does not serve the client’s interest or exposes them to harm that the client cannot understand or prevent.”
For example, out of loyalty to the client, a lawyer should decline to modify a client’s estate planning when, “Lawyer’s reasonable belief is that Client lacks the capacity to make a decision reflecting Client’s interest and that Client’s preferred course would expose Client to the risk of exploitation.”
Second, a lawyer has an obligation to make judgments or decisions relating to the client’s capacity. “A lawyer may assist a client whose testamentary capacity appears to be borderline, including by taking steps to preserve evidence that would support a finding of capacity.” With the client’s consent, a lawyer may involve a, “ … professional with an understanding of the cognitive and emotional issues involved in determining the client’ capacity and how the attorney-client relationship should be adjusted to reflect them.”
Third, a lawyer may sometimes have authority to take some protective actions on behalf of a client with diminished capacity.
The opinion states that, “ … absent a final judicial determination of incapacity, a lawyer’s reasonable belief that a client is incapacitated should not by itself terminate the lawyer’s authority to take protective action in the client’s best interest if such action is within the scope of the representation. Moreover, whether the lawyer has authority to take protective action involves the lawyer’s duty of loyalty, ‘to protect the client in every possible way.’”
However, before an attorney takes protective action, the lawyer must consider his or her duties of confidentiality and loyalty to the client.
Generally speaking, a lawyer needs the client’s informed consent to disclose confidential information. “If the client lacks the capacity to give such consent, is unavailable, or declines to give such consent, the lawyer may not make such disclosures.”
For example, “if a lawyer is able to contact Client directly, and if Client, notwithstanding the cognitive deficits …, can give informed consent, Lawyer may not be able to disclose confidential information to concerned relatives or other authorities.”
Fourth, a lawyer may obtain a client’s advanced consent to the lawyer's disclosure of confidential information, “if the client’s future diminished capacity exposes the client to harm that could be prevented by such disclosure.”
Such advanced consent requires a sufficiently comprehensive explanation to the client of the conditions for disclosure, the factual scenario contemplated, and the benefits and the risks involved with disclosure. Such consent must be revocable at any time.
Representing clients with diminished capacity often involve areas of law and facts that are unclear.
An attorney whose “judgments are informed and disinterested [i.e unbiased] … should not be viewed as unethical simply because subsequent events proved them to have been mistaken.”
The foregoing is a brief summary of a twenty page legal opinion and is not legal advice. Anyone confronting the issues addressed should consult with a qualified attorney.
Dennis A. Fordham, attorney, is a State Bar-Certified Specialist in estate planning, probate and trust law. His office is at 870 S. Main St., Lakeport, Calif. He can be reached at This email address is being protected from spambots. You need JavaScript enabled to view it. and 707-263-3235.

 How to resolve AdBlock issue?