LAKEPORT, Calif. – The Lakeport City Council this week will present two proclamations, meet a new employee, set a public hearing and consider awarding a project for a city project.
The council will meet Tuesday, April 16, at 6 p.m. in the council chambers at Lakeport City Hall, 225 Park St.
The council chambers will be open to the public for the meeting. Masks are highly encouraged where 6-foot distancing cannot be maintained.
If you cannot attend in person, and would like to speak on an agenda item, you can access the Zoom meeting remotely at this link or join by phone by calling toll-free 669-900-9128 or 346-248-7799.
The webinar ID is 973 6820 1787, access code is 477973; the audio pin will be shown after joining the webinar. Those phoning in without using the web link will be in “listen mode” only and will not be able to participate or comment.
Comments can be submitted by email to This email address is being protected from spambots. You need JavaScript enabled to view it.. To give the city clerk adequate time to print out comments for consideration at the meeting, please submit written comments before 3:30 p.m. on Tuesday, April 16.
On Tuesday, the council will meet new city employee Melissa Carpenter, and present proclamations designating April 2024 as Child Abuse Prevention Month and Sexual Assault Awareness Month.
The agenda includes a public hearing on a proposed ordinance revising Lakeport Municipal Code Chapter 3.34 regarding fire mitigation fees and direction to city staff to schedule a public hearing for the second reading of the ordinance for May 7.
Under council business, Community Development Director Joey Hejnowicz will ask the council to adopt a resolution for “Affirmatively Furthering Fair Housing” in Lakeport.
That will be followed by a request from Public Works Director Ron Ladd to approve the plans, specifications and working details and award a construction contract to T&T Paving, Inc. dba Valley Paving for the South Main Street Sidewalk Project and authorize City Manager Kevin Ingram to execute the construction contract for the bid amount of $334,279.15.
On the consent agenda — items considered noncontroversial and usually accepted as a slate on one vote — are ordinances; minutes of the City Council’s special meeting on March 28 and regular meeting on April 2; approval of application 2024-016, with staff recommendations, for the Missing and Murdered Indigenous People Day walk; adoption of the proposed resolution adopting a records retention schedule, and authorizing destruction of certain city records and rescinding Resolution No. 2908 (2023); and adoption of the resolution accepting construction of the Lakefront Park Project by Builder Solutions Inc. and authorization of the filing of the notice of completion.
Email Elizabeth Larson at This email address is being protected from spambots. You need JavaScript enabled to view it.. Follow her on Twitter, @ERLarson, or Lake County News, @LakeCoNews.
LAKE COUNTY, Calif. — Lake County Animal Care and Control has many dogs of various breeds waiting for their new homes.
Dogs available for adoption this week include mixes of Alaskan husky, American blue heeler, Anatolian shepherd, border collie, German shepherd, hound, Labrador Retriever, pit bull terrier, Rottweiler and Weimaraner.
Dogs that are adopted from Lake County Animal Care and Control are either neutered or spayed, microchipped and, if old enough, given a rabies shot and county license before being released to their new owner. License fees do not apply to residents of the cities of Lakeport or Clearlake.
Those dogs and the others shown on this page at the Lake County Animal Care and Control shelter have been cleared for adoption.
Call Lake County Animal Care and Control at 707-263-0278 or visit the shelter online for information on visiting or adopting.
The shelter is located at 4949 Helbush in Lakeport.
Email Elizabeth Larson at This email address is being protected from spambots. You need JavaScript enabled to view it.. Follow her on Twitter, @ERLarson, or Lake County News, @LakeCoNews.
Dennis Fordham. Courtesy photo. In addition to signing all necessary estate planning documents to put one’s affairs in order, it is necessary to consider what additional information will be needed by the persons carrying out the estate plan when the time comes.
First, it is necessary for the individual named to carry out the estate plan to know that there are estate planning documents in place, where those documents are kept, and how to gain access to them. Without such basic knowledge the family of an incapacitated or deceased person will not even know on what path to proceed.
For example, take the son of an incapacitated mother who did not know that she had transferred her financial assets to a living trust and did not know where her trust document was kept. Thus, he did not know that such planning was in place and proceeded with a court conservatorship proceeding in order to gain control over the mother’s assets to pay for her care.
The conservatorship was unnecessary under the circumstances, but the son did not know this. Eventually, the son contacted an attorney and the mother’s estate planning documents were located. The take-away is to tell the appropriate person(s) that you have estate planning documents and where they are kept.
Second, estate planning may include designating death beneficiaries to bank, brokerage and life insurance assets. This work typically does not involve the estate planning attorney as the beneficiary forms are provided by the financial institution to the customer to complete.
The disconnect between the estate plan prepared by the attorney and the death beneficiary forms prepared by the client/customer means that the estate planning binder oftentime does not disclose the identities of the account(s) and the death beneficiaries.
It is wise, therefore, to keep copies of the designated death beneficiary forms inside the estate planning binder (or other compilation of estate planning documents) so that the person administering the estate knows about such non-trust assets and knows the identities of the death beneficiaries.
These beneficiaries will then be told to contact the financial institution to request the beneficiary claims package.
For example, take the decedent who has his affairs in order except that the successor trustee discovers a retirement plan account and cannot ascertain who is the death beneficiary.
Is the beneficiary the decedent’s trust, an individual beneficiary or is it a charitable beneficiary?
Unfortunately, banks and brokerages will only provide account information about a decedent to a court appointed personal representative; this means opening a probate proceeding.
The successor trustee managing the decedent’s trust may try various hit or miss attempts at guessing who might be the designated beneficiary and having such person(s) contact the bank or brokerage to make a claim as the death beneficiary.
Alternatively, the situation may end up only be resolved by opening a probate that is otherwise unnecessary as death beneficiaries were named and so normally avoids probate.
Third, some valuable or sentimental assets may be stored in undisclosed (hidden) locations. Unless the person administering the estate knows where and how to access such valuables, it is possible that such assets will be lost due to not knowing where they are.
For example, consider the parent who hides valuable gold bars for their protection. The parent dies unexpectedly before telling his child where the gold bars are located.
Such unfortunate results may occur if someone takes it for granted that they will get to disclose such information before death but are not yet ready to do so presently. That approach is risky business.
In sum, consider what is important. Practical information about one’s estate planning and assets needs to be provided in advance to the person who will be administering the estate. This increases the likelihood of a successful administration down the road.
The foregoing brief discussion is not legal advice. Consult a qualified estate planning attorney for guidance.
Dennis A. Fordham, attorney, is a State Bar-Certified Specialist in estate planning, probate and trust law. His office is at 870 S. Main St., Lakeport, Calif. He can be reached at This email address is being protected from spambots. You need JavaScript enabled to view it. and 707-263-3235.
Nearly 327,000 people in the United States experiencing homelessness lived in shelters, a small proportion (0.1%) of the U.S. population from 2018 to 2022 but higher than from 2013 to 2017, according to American Community Survey (ACS) 5-year estimates released in a working paper.
The 2013-2017 ACS, the previous 5-year ACS with no overlapping years, showed there were approximately 267,000 people (0.08% of the U.S. population) in shelters during that period.
A change in the number of people experiencing homelessness and living in shelters could be due to a change in economic circumstances or resources devoted to shelters or a combination of both.
Group quarters are places — owned or managed by an entity or organization providing housing and/or services for the residents — where people live or stay in a group arrangement.
They consist of institutional (residents primarily not eligible, able or likely to participate in the labor force) and noninstitutional (residents primarily eligible, able or likely to participate in labor force) facilities. Noninstitutional group quarters include places like college dorms and military housing and other noninstitutional facilities.
In the ACS, the sheltered population experiencing homelessness is sampled from facilities where people stay overnight as part of the noninstitutional facilities:
• That operate on a first-come, first-served basis where people must leave the next morning and have no guaranteed bed for another night. • Where people are assigned a bed for a specified period (even if they leave the building daily). • That provide temporary shelter during extremely cold weather (like churches). This category does not include shelters that operate only in the event of a natural disaster.
The sheltered population is an estimate of the population experiencing homelessness that stay in emergency and transitional shelters. It is not a complete count of the total U.S. population experiencing homelessness, which the Department of Housing and Urban Development (HUD) estimated was 582,500 in 2022. HUD conducts a Point-in-Time count of sheltered people experiencing homelessness on a single night in January every year and a count of unsheltered people every other year.
It’s important to note that some detailed group quarters types are included in the decennial census as “other noninstitutional facilities” but not in the ACS, which may lead to higher or overestimates of this population in the ACS. More information about this is available in Estimates of the Population Experiencing Homelessness and Living in Shelters.
Who are the people who stay in shelters?
Figure 1 shows the share of the sheltered population experiencing homelessness and the population in households and other living quarters (people who lived in households and in group quarters other than emergency shelters) by different demographic groups.
Among the sheltered population experiencing homelessness: 40% were female; 8% were under the age of 18; 8% were age 65 or over; 32% were non-Hispanic White; 37% were non-Hispanic Black; and 35% had a disability.
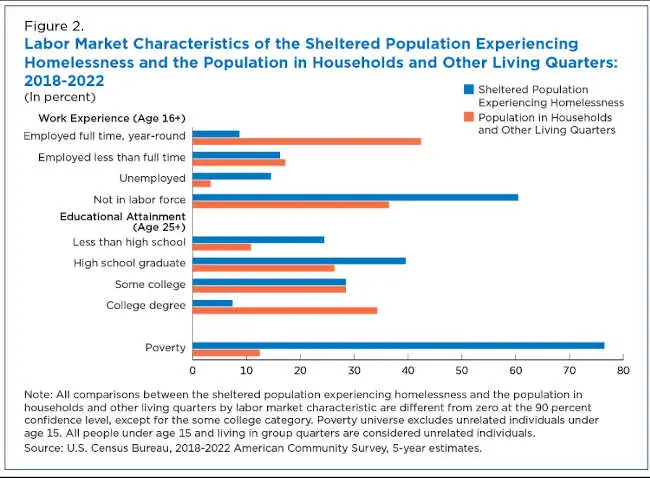
Figure 2 shows the labor market characteristics of both the sheltered population experiencing homelessness and the population in households and other living quarters.
Among the sheltered population age 16 and over experiencing homelessness, nearly 15% were unemployed and an additional 61% were not in the labor force. That means only about 25% of this population was employed compared to nearly 60% of the population in households and other living quarters.
Among the sheltered population age 25 and over experiencing homelessness, nearly 25% did not have a high school degree and just over 7% had a bachelor’s degree or higher. Low educational attainment and high unemployment likely contributed to a poverty rate over six times higher (76.5%) than for the population in households and other living quarters (12.5%).
Also important to note: nearly one quarter of people experiencing homelessness and living in shelters were not in poverty.
The national poverty rate in 2018-2022 was 12.53%. When excluding the sheltered population experiencing homelessness, the poverty rate was 12.47%, which is not significantly different statistically.
Sheltered population by state
There was a lot of variation in both the number and rate of the population experiencing homelessness in shelters in each state in 2018-2022.
The sheltered population ranged from a low of 173 people in Wyoming to a high of 83,550 people in New York. In fact, four states accounted for over 50% of the total U.S. sheltered population experiencing homelessness: New York (83,550); California (57,700); Texas (15,340); and Florida (13,260).
While 10 out of every 10,000 people lived in a shelter nationally, this rate ranged from a low of 1.5 in Mississippi to a high of 61.5 in the District of Columbia (Figure 3).
Figure 4 shows the ratio of the state share of the U.S. sheltered population to the state share of the total U.S. population. This tells us whether the share of the sheltered population experiencing homelessness in each state was higher or lower than the share of the total U.S. population in each state.
For example, New York had a ratio of 4.23 with about 6% of the U.S. population, but over 25% of the total sheltered population experiencing homelessness. Conversely, Texas had a ratio of 0.53 with nearly 9% of the U.S. population, but only about 5% of the total sheltered population experiencing homelessness.
The share of the sheltered population experiencing homelessness was higher than the state’s share of the U.S. population in 10 states and the District of Columbia and lower in 35 states. The ratio of the two population shares was not significantly different in 5 states.
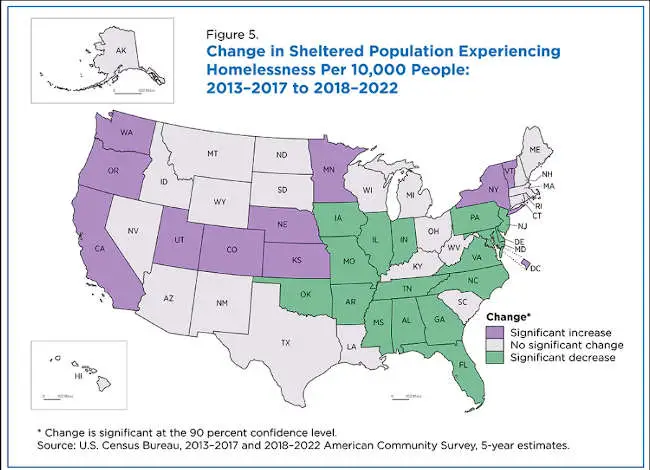
Figure 5 shows which states had a significant change in sheltered populations experiencing homelessness per 10,000 people in 2018-2022 compared to the 2013-2017 period.
While the number increased nationally, it only rose in 10 states and the District of Columbia. The sheltered population experiencing homelessness per 10,000 people decreased in 17 states and did not change significantly in the other 23 states.
Brian Glassman is an economist and chief of the Census Bureau’s Poverty Statistics Branch.
Stars like the Sun are remarkably constant. They vary in brightness by only 0.1% over years and decades, thanks to the fusion of hydrogen into helium that powers them. This process will keep the Sun shining steadily for about 5 billion more years, but when stars exhaust their nuclear fuel, their deaths can lead to pyrotechnics.
Supernovae happen across the Milky Way only a few times a century, and these violent explosions are usually remote enough that people here on Earth don’t notice. For a dying star to have any effect on life on our planet, it would have to go supernova within 100 light years from Earth.
In my writing about cosmic endings, I’ve described the threat posed by stellar cataclysms such as supernovae and related phenomena such as gamma-ray bursts. Most of these cataclysms are remote, but when they occur closer to home they can pose a threat to life on Earth.
The dying star emits high energy radiation as gamma rays. Gamma rays are a form of electromagnetic radiation with wavelengths much shorter than light waves, meaning they’re invisible to the human eye. The dying star also releases a torrent of high-energy particles in the form of cosmic rays: subatomic particles moving at close to the speed of light.
Supernovae in the Milky Way are rare, but a few have been close enough to Earth that historical records discuss them. In 185 A.D., a star appeared in a place where no star had previously been seen. It was probably a supernova.
Observers around the world saw a bright star suddenly appear in 1006 A.D. Astronomers later matched it to a supernova 7,200 light years away. Then, in 1054 A.D., Chinese astronomers recorded a star visible in the daytime sky that astronomers subsequently identified as a supernova 6,500 light years away.
At 600 light years away, the red supergiant Betelgeuse in the constellation of Orion is the nearest massive star getting close to the end of its life. When it goes supernova, it will shine as bright as the full Moon for those watching from Earth, without causing any damage to life on our planet.
Radiation damage
If a star goes supernova close enough to Earth, the gamma-ray radiation could damage some of the planetary protection that allows life to thrive on Earth. There’s a time delay due to the finite speed of light. If a supernova goes off 100 light years away, it takes 100 years for us to see it.
Astronomers have found evidence of a supernova 300 light years away that exploded 2.5 million years ago. Radioactive atoms trapped in seafloor sediments are the telltale signs of this event. Radiation from gamma rays eroded the ozone layer, which protects life on Earth from the Sun’s harmful radiation. This event would have cooled the climate, leading to the extinction of some ancient species.
Safety from a supernova comes with greater distance. Gamma rays and cosmic rays spread out in all directions once emitted from a supernova, so the fraction that reach the Earth decreases with greater distance. For example, imagine two identical supernovae, with one 10 times closer to Earth than the other. Earth would receive radiation that’s about a hundred times stronger from the closer event.
A supernova within 30 light years would be catastrophic, severely depleting the ozone layer, disrupting the marine food chain and likely causing mass extinction. Some astronomers guess that nearby supernovae triggered a series of mass extinctions 360 to 375 million years ago. Luckily, these events happen within 30 light years only every few hundred million years.
Left behind after a supernova explosion, neutron stars are city-size balls of matter with the density of an atomic nucleus, so 300 trillion times denser than the Sun. These collisions created many of the gold and precious metals on Earth. The intense pressure caused by two ultradense objects colliding forces neutrons into atomic nuclei, which creates heavier elements such as gold and platinum.
Neutron stars merge when gravity pulls them together, which releases intense radiation.
A neutron star collision generates an intense burst of gamma rays. These gamma rays are concentrated into a narrow jet of radiation that packs a big punch.
If the Earth were in the line of fire of a gamma-ray burst within 10,000 light years, or 10% of the diameter of the galaxy, the burst would severely damage the ozone layer. It would also damage the DNA inside organisms’ cells, at a level that would kill many simple life forms like bacteria.
Gamma-ray bursts may not hold an imminent threat to life on Earth, but over very long time scales, bursts will inevitably hit the Earth. The odds of a gamma-ray burst triggering a mass extinction are 50% in the past 500 million years and 90% in the 4 billion years since there has been life on Earth.
The most extreme astrophysical events have a long reach. Astronomers were reminded of this in October 2022, when a pulse of radiation swept through the solar system and overloaded all of the gamma-ray telescopes in space.
It was the brightest gamma-ray burst to occur since human civilization began. The radiation caused a sudden disturbance to the Earth’s ionosphere, even though the source was an explosion nearly 2 billion light years away. Life on Earth was unaffected, but the fact that it altered the ionosphere is sobering – a similar burst in the Milky Way would be a million times brighter.
CLEARLAKE, Calif. — Clearlake Animal Control has more new dogs waiting to go to their forever families this week.
The Clearlake Animal Control website lists 34 adoptable dogs.
“Romeo.” Photo courtesy of Clearlake Animal Control. This week’s dogs include “Romeo,” a male German shepherd mix with a tricolor coat.
And of course there is “Juliet,” a 2-year-old chocolate Labrador retriever mix.
“Juliet.” Photo courtesy of Clearlake Animal Control.
The shelter is located at 6820 Old Highway 53. It’s open from 9 a.m. to 6 p.m. Tuesday through Saturday.
For more information, call the shelter at 707-762-6227, email This email address is being protected from spambots. You need JavaScript enabled to view it., visit Clearlake Animal Control on Facebook or on the city’s website.
This week’s adoptable dogs are featured below.
Email Elizabeth Larson at This email address is being protected from spambots. You need JavaScript enabled to view it.. Follow her on Twitter, @ERLarson, or Lake County News, @LakeCoNews.
LAKE COUNTY, Calif. — National Public Safety Telecommunicators Week, April 14 to 20, is an opportunity to shine the light on the unseen heroes who keep us safe in our times of greatest need.
Public safety dispatchers play a critical role in orchestrating emergency response efforts, providing vital information to both the callers and emergency responders.
“These women and men are the first point of contact during an emergency, navigating a crisis with composure and expertise to provide vital instructions, while seamlessly coordinating efforts behind the scenes,” said California Highway Patrol Commissioner Sean Duryee. “Their dedication and unwavering commitment to public service deserve praise and recognition.”
The CHP has more than 700 dedicated professionals who serve in that role, working on the front lines of public safety and service, fielding a vast majority of cellular 9-1-1 calls in the state.
Last year, the CHP handled approximately 6.6 million calls for service statewide. Of those calls, 4.6 million were to 9-1-1.
In addition to their primary responsibilities, dispatchers often act as lifelines for individuals in distress offering reassurance, guidance, and support until help arrives.
Their ability to remain calm under pressure, think quickly on their feet, and maintain professionalism in the face of chaos is truly commendable.
The CHP has several openings for public safety dispatchers and public safety operators and is actively recruiting Californians to answer the call of this rewarding career.
For more information, register to attend an online hiring seminar at 6:30 p.m. on Wednesday, April 24. Or take the next step and apply today.
The mission of the CHP is to provide the highest level of safety, service and security.
Condor Ridge at sunset. Photo by Bob Wick. LAKE COUNTY, Calif. — The Berryessa Snow Mountain National Monument is expected to soon be expanded thanks to anticipated action by President Joe Biden.
The 330,780-acre monument — most of which is located in Lake County — is being considered for expansion through the addition of the Walker Ridge area.
That area, totaling 13,753 acres, will be referred to as “Molok Luyuk,” which means, “Condor Ridge,” in the Patwin language.
Reports came out of Washington, D.C. this week that President Biden plans to approve the monument’s expansion.
Biden was vice president when, on July 10, 2015, President Barack Obama — following an extensive campaign by state, local, tribal and federal representatives — designated the monument, which runs across the California Coastal Range in Colusa, Glenn, Lake, Mendocino, Napa, Solano and Yolo counties.
The rugged land boasts abundant wildlife, plants and other natural resources, and is a haven for outdoor recreation. It is managed by the Mendocino National Forest and the Bureau of Land Management.
Congressman Mike Thompson, Lake County’s longtime member of the House of Representatives, introduced the original legislation to designate Berryessa Monument back in 2015 and is the co-sponsor of the bill to expand the monument, as well.
"I worked to designate the Berryessa Snow Mountain region as a national monument in 2015, and I've worked to expand it ever since. The Monument's designation has played a crucial role in protecting the biodiversity of Northern California and an expansion of the Monument would have an immense positive impact on the region,” Thompson said.
While Biden’s action on the monument is pending, Sen. Bill Dodd, D-Napa, has a resolution urging the Berryessa Snow Mountain expansion which is set to be heard in a state Senate committee early next week.
“I thank the president for recognizing the incredible beauty and rich resources that make Berryessa Snow Mountain one of the most scenic and diverse landscapes in all of Northern California,” Sen. Dodd said. “It is vital to include this additional piece, which was home to native tribes for thousands of years. We can recognize the land’s cultural significance while protecting it for generations to come.”
In 2015, Sen. Dodd wrote Assembly Joint Resolution 4, the first time a state Legislature passed a measure asking the president to create a national monument. At that time, he was the Assembly member representing an area that included Lake County.
“I am proud to have been on hand when President Obama finalized the official designation,” Sen. Dodd said.
The designation arrives amid vanishing wild lands around the world. Nationwide, natural land is declining at a rate of one football field every 30 seconds, threatening plant and animal species and contributing to climate change, Dodd pointed out.
In response, both President Joe Biden and Gov. Gavin Newsom have championed the so-called 30X30 goal, which sets aside 30% of natural and coastal waters by 2030 to protect habitat, preserve history and maintain recreational opportunities.
Now, proposals before the president and Congress would expand Berryessa Snow Mountain Monument by 3,900 acres in Lake County.
They also support renaming the area commonly known as Walker Ridge to Molok Luyuk, reflecting the area’s cultural significance to many federally recognized tribes in the region.
By doing so, it would also provide opportunities for partnerships between the tribes, BLM and the U.S. Forest Service.
Sen. Dodd’s Senate Joint Resolution 10 helps fulfill state and federal goals by supporting federal approval of the monument’s expansion.
The state Senate Natural Resources committee is expected to endorse Sen. Dodd’s bill in a hearing on Monday.
Editor’s note: This story has been updated with additional information on the original legislation by Congressman Mike Thompson.
Adi Foord, University of Maryland, Baltimore County
Curious Kids is a series for children of all ages. If you have a question you’d like an expert to answer, send it to This email address is being protected from spambots. You need JavaScript enabled to view it..
If the James Webb telescope was 10 times more powerful, could we see the beginning of time? - Sam H., age 12, Prosper, Texas
The James Webb Space Telescope, or JWST for short, is one of the most advanced telescopes ever built. Planning for JWST began over 25 years ago, and construction efforts spanned over a decade. It was launched into space on Dec. 25, 2021, and within a month arrived at its final destination: 930,000 miles away from Earth. Its location in space allows it a relatively unobstructed view of the universe.
The telescope design was a global effort, led by NASA, and intended to push the boundaries of astronomical observation with revolutionary engineering. Its mirror is massive – about 21 feet (6.5 meters) in diameter. That’s nearly three times the size of the Hubble Space Telescope, which launched in 1990 and is still working today.
It’s a telescope’s mirror that allows it to collect light. JWST’s is so big that it can “see” the faintest and farthest galaxies and stars in the universe. Its state-of-the-art instruments can reveal information about the composition, temperature and motion of these distant cosmic objects.
As an astrophysicist, I’m continually looking back in time to see what stars, galaxies and supermassive black holes looked like when their light began its journey toward Earth, and I’m using that information to better understand their growth and evolution. For me, and for thousands of space scientists, the James Webb Space Telescope is a window to that unknown universe.
Just how far back can JWST peer into the cosmos and into the past? About 13.5 billion years.
This illustration of the front view of the James Webb Space Telescope shows its sun shield and golden mirrors.NASA/ESA/CSA/Northrop Grumman
Time travel
A telescope does not show stars, galaxies and exoplanets as they are right now. Instead, astronomers are catching a glimpse of how they were in the past. It takes time for light to travel across space and reach our telescopes. In essence, that means a look into space is also a trip back in time.
This is even true for objects that are quite close to us. The light you see from the Sun left it about 8 minutes, 20 seconds earlier. That’s how long it takes for the Sun’s light to travel to Earth.
You can easily do the math on this. All light – whether sunlight, a flashlight or a light bulb in your house – travels at 186,000 miles (almost 300,000 kilometers) per second. That’s just over 11 million miles (about 18 million kilometers) per minute. The Sun is about 93 million miles (150 million kilometers) from Earth. That comes out to about 8 minutes, 20 seconds.
But the farther away something is, the longer its light takes to reach us. That’s why the light we see from Proxima Centauri, the closest star to us aside from our Sun, is 4 years old; that is, it’s about 25 trillion miles (approximately 40 trillion kilometers) away from Earth, so that light takes just over four years to reach us. Or, as scientists like to say, four light years.
The James Webb Space Telescope is looking much farther back in time than previously possible with other telescopes, such as the Hubble Space Telescope. For example, although Hubble can see objects 60,000 times fainter than the human eye is able, the JWST can see objects almost nine times fainter than even Hubble can.
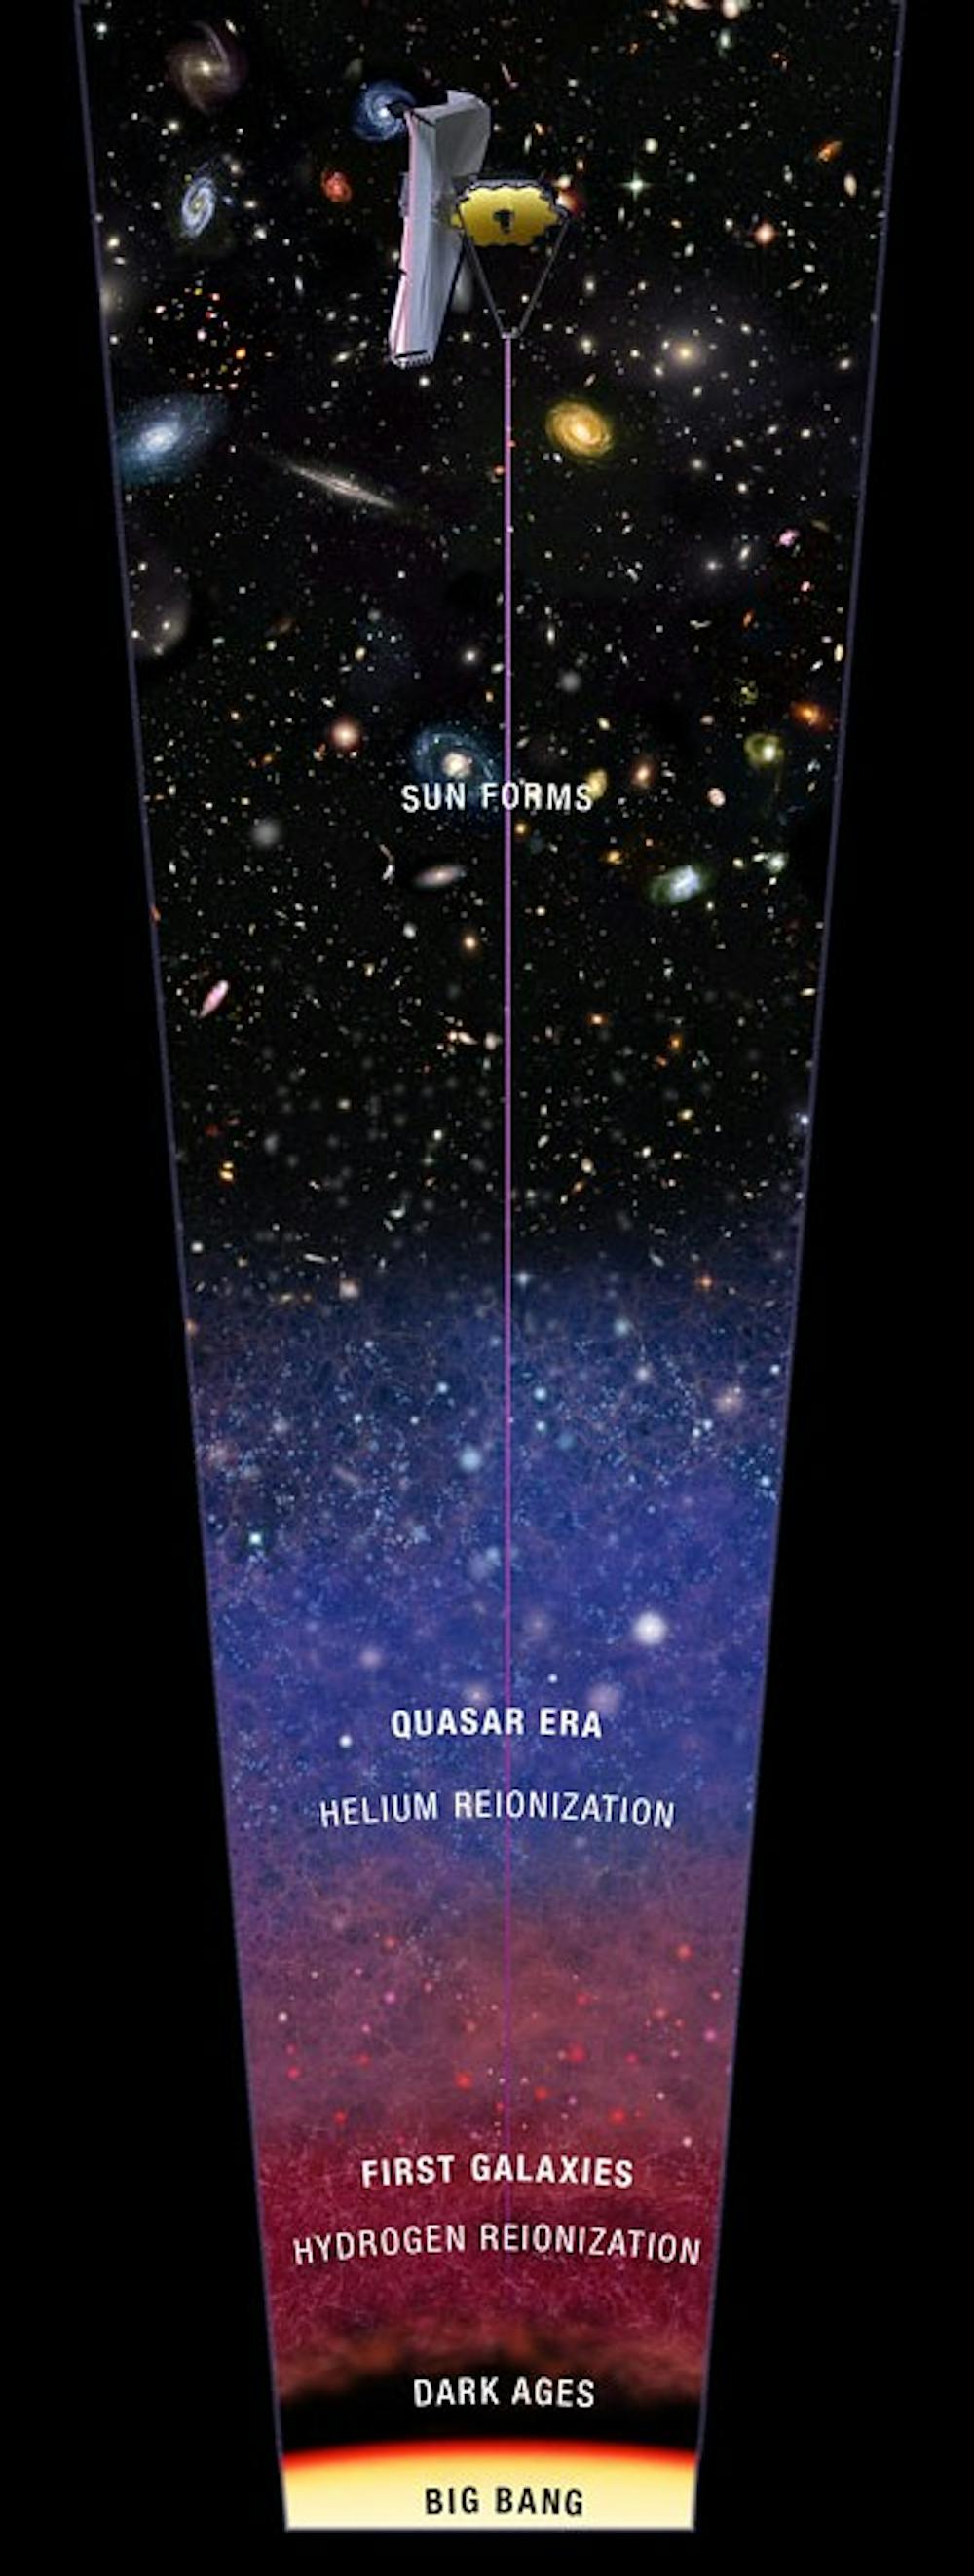
The James Webb Space Telescope can see back 13.5 billion years – back to when the first stars and galaxies began to form.STScI
The Big Bang
But is it possible to see back to the beginning of time?
The name is a bit misleading, however, because it suggests that some sort of explosion, like fireworks, created the universe. The Big Bang more closely represents the appearance of rapidly expanding space everywhere in the universe. The environment immediately after the Big Bang was similar to a cosmic fog that covered the universe, making it hard for light to travel beyond it. Eventually, galaxies, stars and planets started to grow.
That’s why this era in the universe is called the “cosmic dark ages.” As the universe continued to expand, the cosmic fog began to rise, and light was eventually able to travel freely through space. In fact, a few satellites have observed the light left by the Big Bang, about 380,000 years after it occurred. These telescopes were built to detect the splotchy leftover glow from the Big Bang, whose light can be tracked in the microwave band.
However, even 380,000 years after the Big Bang, there were no stars and galaxies. The universe was still a very dark place. The cosmic dark ages wouldn’t end until a few hundred million years later, when the first stars and galaxies began to form.
This is a JWST image of NGC 604, a star-forming region about 2.7 million light years from Earth.NASA/ESA/CSA/STScI
The James Webb Space Telescope was not designed to observe as far back as the Big Bang, but instead to see the period when the first objects in the universe began to form and emit light. Before this time period, there is little light for the James Webb Space Telescope to observe, given the conditions of the early universe and the lack of galaxies and stars.
Peering back to the time period close to the Big Bang is not simply a matter of having a larger mirror – astronomers have already done it using other satellites that observe microwave emission from very soon after the Big Bang. So, the James Webb Space Telescope observing the universe a few hundred million years after the Big Bang isn’t a limitation of the telescope. Rather, that’s actually the telescope’s mission. It’s a reflection of where in the universe we expect the first light from stars and galaxies to emerge.
By studying ancient galaxies, scientists hope to understand the unique conditions of the early universe and gain insight into the processes that helped them flourish. That includes the evolution of supermassive black holes, the life cycle of stars, and what exoplanets – worlds beyond our solar system – are made of.
Hello, curious kids! Do you have a question you’d like an expert to answer? Ask an adult to send your question to This email address is being protected from spambots. You need JavaScript enabled to view it.. Please tell us your name, age and the city where you live.
And since curiosity has no age limit – adults, let us know what you’re wondering, too. We won’t be able to answer every question, but we will do our best.
The more scientists learn about the health risks of PFAS, found in everything from nonstick cookware to carpets to ski wax, the more concerning these “forever chemicals” become.
The U.S. Environmental Protection Agency now believes there is no safe level for two common PFAS – PFOA and PFOS – in drinking water, and it acknowledges that very low concentrations of other PFAS present human health risks. The agency issued the first legally enforceable national drinking water standards for five common types of PFAS chemicals, as well as PFAS mixtures, on April 10, 2024.
I study PFAS as an environmental health scientist. Here’s a quick look at the risks these chemicals pose and efforts to regulate them.
What exactly are PFAS?
PFAS stands for per- and polyfluoroalkyl substances. This is a large group of human-made chemicals – currently estimated to be nearly 15,000 individual chemical compounds – that are used widely in consumer products and industry. They can make products resistant to water, grease and stains and protect against fire.
Waterproof outdoor apparel and cosmetics, stain-resistant upholstery and carpets, food packaging that is designed to prevent liquid or grease from leaking through, and certain firefighting equipment often contain PFAS.
In fact, studies have found that most products labeled stain- or water-resistant contain PFAS, and another study found that this is even true among products labeled as “nontoxic” or “green.” PFAS are also found in unexpected places such as high-performance ski and snowboard waxes, floor waxes and medical devices.
Firefighters are concerned that PFAS in firefighting foams and protective gear could be a reason cancer rates are rising.AP Photo/Steven Senne
At first glance, PFAS sound pretty useful, so you might be wondering what’s the big deal?
The short answer is that PFAS are harmful to human health and the environment.
Some of the very same chemical properties that make PFAS attractive in products also mean these chemicals will persist in the environment for generations. Because of the widespread use of PFAS, these chemicals are now present in water, soil and living organisms and can be found across almost every part of the planet, including Arctic glaciers, marine mammals, remote communities living on subsistence diets and in 98% of the American public.
Once people are exposed to PFAS, the chemicals remain in their bodies for a long time – months to years, depending on the specific compound – and they can accumulate over time.
Research consistently demonstrates that PFAS are associated with a variety of adverse health effects. A review by a panel of experts looking at research on PFAS toxicity concluded with a high degree of certainty that PFAS contribute to thyroid disease, elevated cholesterol, liver damage, and kidney and testicular cancer.
Further, they concluded with a high degree of certainty that PFAS also affect babies exposed in utero by increasing their likelihood of being born at a lower birth weight and responding less effectively to vaccines, while impairing women’s mammary gland development, which may adversely affect a mom’s ability to breastfeed.
The review also found evidence that PFAS may contribute to a number of other disorders, though further research is needed to confirm existing findings: inflammatory bowel disease, reduced fertility, breast cancer, and an increased likelihood of miscarriage and developing high blood pressure and preeclampsia during pregnancy. Additionally, current research suggests that babies exposed prenatally are at higher risk of experiencing obesity, early-onset puberty and reduced fertility later in life.
Collectively, this is a formidable list of diseases and disorders.
Who’s regulating PFAS?
PFAS chemicals have been around since the late 1930s, when a DuPont scientist created one by accident during a lab experiment. DuPont called it Teflon, which eventually became a household name for its use on nonstick pans.
Decades later, in 1998, Scotchgard maker 3M notified the Environmental Protection Agency that a PFAS chemical was showing up in human blood samples. At the time, 3M said low levels of the manufactured chemical had been detected in people’s blood as early as the 1970s.
The Agency for Toxic Substances and Disease Registry has a toxicological profile for PFAS. And the EPA had issued advisories and health-based guidelines. But despite the lengthy list of serious health risks linked to PFAS and a tremendous amount of federal investment in PFAS-related research in recent years, PFAS hadn’t been regulated at the federal level in the United States until now.
The new drinking water standards set limits for five individual PFAS – PFOA, PFOS, PFNA, PFHxS and HFPO-DA – as well as mixtures of these chemicals. The standards are part of the EPA’s road map for PFAS regulations.
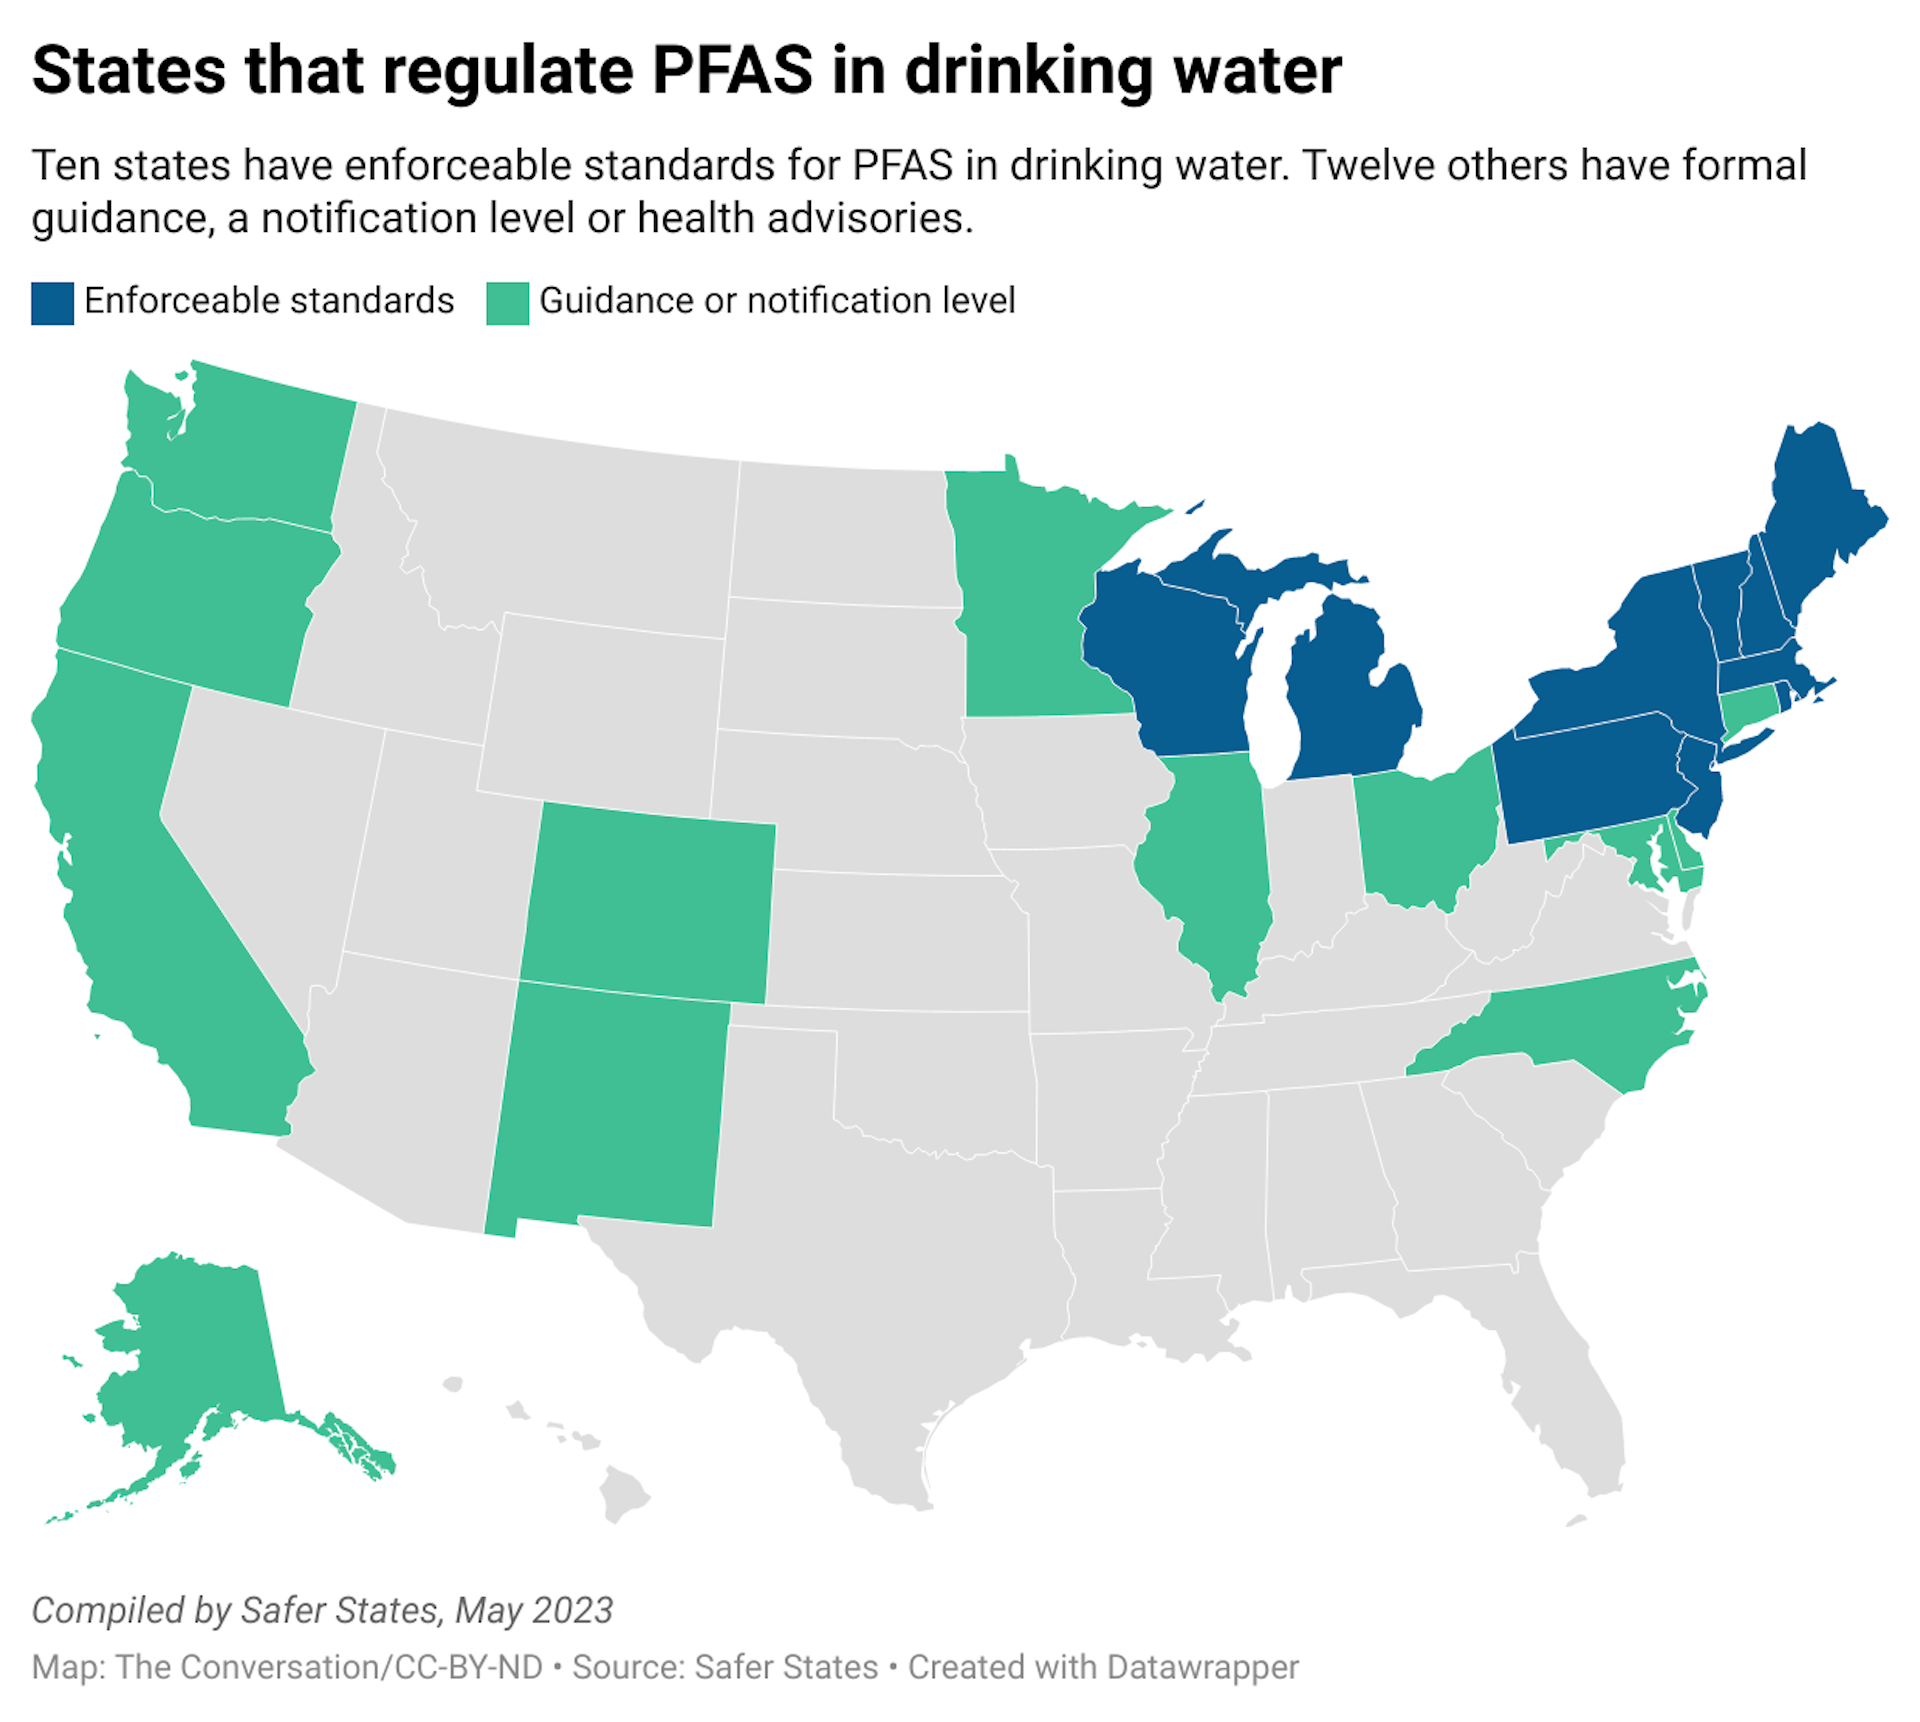
While waiting for federal action, states have taken their own steps to protect residents against the risk of PFAS exposure.
At least 28 states have laws targeting PFAS in various uses, such as in food packaging and carpets. About a dozen have drinking water standards for PFAS. But relying on state laws creates a patchwork of regulations, which places burdens on businesses and consumers to navigate regulatory nuances across state lines.
How can you reduce your PFAS exposure?
Based on current scientific understanding, most people are exposed to PFAS primarily through their diet, though drinking water and airborne exposures may be significant among some people, especially if they live near known PFAS-related industries or contamination.
The best ways to protect yourself and your family from risks associated with PFAS are to educate yourself about potential sources of exposure.
Products labeled as water- or stain-resistant have a good chance of containing PFAS. When possible, check the ingredients on products you buy and watch for chemical names containing “fluor-.” Specific trade names, such as Teflon and Gore-Tex, are also likely to contain PFAS.
Check whether there are sources of contamination near you, such as in drinking water or PFAS-related industries in the area. Strategies for monitoring and reporting PFAS contamination vary by location and PFAS source, so the absence of readily available information does not necessarily mean the region is free of PFAS problems.
If you believe you have been exposed to PFAS and are concerned about your health, contact your health care provider. The National Academies of Sciences, Engineering, and Medicine have published guidance on PFAS exposure, testing and clinical follow-up, which includes information to help health care professionals understand monitoring and clinical implications of PFAS exposure.
Anil Makam, MD, MAS, works with a patient in an ICU room at Zuckerberg San Francisco General Hospital in San Francisco. Makam’s research looks at the long-term effects of severe COVID-19 illness among the sickest of survivors early in the pandemic. Photo by Erin Lubin.
Most of those who were discharged to long-term acute care centers had ailments that lasted for more than a year.
UC San Francisco researchers examined COVID-19 patients across the United States who survived some of the longest and most harrowing battles with the virus and found that about two-thirds still had physical, psychiatric, and cognitive problems for up to a year later.
The study, which appeared April 10 in the journal Critical Care Medicine, reveals the life-altering impact of SARS-CoV-2 on these individuals, the majority of whom had to be placed on mechanical ventilators for an average of one month.
Too sick to be discharged to a skilled nursing home or rehabilitation facility, these patients were transferred instead to special hospitals known as long-term acute care hospitals (LTACHs). These hospitals specialize in weaning patients off ventilators and providing rehabilitation care, and they were a crucial part of the pandemic response.
Among the 156 study participants, 64% reported having a persistent impairment after one year, including physical (57%), respiratory (49%), psychiatric (24%), and cognitive (15%). Nearly half, or 47%, had more than one type of problem. And 19% continued to need supplemental oxygen.
The long-term follow up helps to outline the extent of the medical problems experienced by those who became seriously ill with COVID early in the pandemic.
“We have millions of survivors of the most severe and prolonged COVID illness globally,” said the study’s first author, Anil N. Makam, MD, MAS, an associate professor of medicine at UCSF. “Our study is important to understand their recovery and long-term impairments, and to provide a nuanced understanding of their life-changing experience.”
Disabilities from long-term hospital stays
Researchers recruited 156 people who had been transferred for COVID to one of nine LTACHs in Nebraska, Texas, Georgia, Kentucky, and Connecticut between March 2020 and February 2021. They questioned them by telephone or online a year after their hospitalization.
The average total length of stay in the hospital and the LTACH for the group was about two months. Their average age was 65, and most said they had been healthy before getting COVID.
In addition to their lingering ailments from COVID, the participants also had persistent problems from their long hospital stays, including painful bedsores and nerve damage that limited the use of their arms or legs.
“Many of the participants we interviewed were most bothered by these complications, so preventing these from happening in the first place is key to recovery,” Makam said.
Although 79% said they had not returned to their usual health, 99% had returned home, and 60% of those who had previously been employed said they had gone back to work.
They were overwhelmingly grateful to have survived, often describing their survival as a “miracle.” But their recovery took longer than expected.
The results underscore that it is normal for someone who has survived such severe illness to have persistent health problems.
“The long-lasting impairments we observed are common to survivors of any prolonged critical illness, and not specific to COVID, and are best addressed through multidisciplinary rehabilitation,” Makam said.
Authors: Additional UCSF co-authors include Oanh Kieu Nguyen, MD, MAS, Eddie Espejo, MA, Cinthia Blat, MPH, W. John Boscardin, Ph.D. and Kenneth E. Covinsky, MD, MPH.
Funding: The work was supported by grants from the National Institutes of Health/National Institute on Aging (K23AG052603), the UCSF Research Evaluation and Allocation Committee (Carson and Hampton Research Funds) and the National Association of Long Term Hospitals. The authors had no conflicts of interest to disclose.
LAKE COUNTY, Calif. — Lake County’s newest municipal advisory council’s members have been selected and the group is expected to hold its first meeting this month.
At its April 2 meeting, the Board of Supervisors selected the five members and one alternate to fill the seats on the council, which will represent the Kelseyville planning area.
The council was officially formed at the board’s March 12 meeting.
The supervisors voted unanimously to appoint Angel Acosta, Megan Lankford, Big Valley Tribal Chair Flaman McCloud, Brian Hanson and Joy Merrilees to the general membership seats, and Greg Panella as the alternate.
Acosta, Lankford, Hanson, Merrilees and Panella were all part of the group involved with drafting the new council’s bylaws.
However, so far, an agenda has not been released or posted on the county’s website, and the new council isn’t listed on the county webpage for board-appointed councils and commissions.
Email Elizabeth Larson at This email address is being protected from spambots. You need JavaScript enabled to view it.. Follow her on Twitter, @ERLarson, or Lake County News, @LakeCoNews.

 How to resolve AdBlock issue?


