Gov. Gavin Newsom, First Partner Jennifer Siebel Newsom and the California Museum on Monday announced the 16th class of trailblazers in public service, sports, music, entertainment and more into the California Hall of Fame.
This posthumous class will be inducted into the California Hall of Fame at 6 p.m. Tuesday, Aug. 22, in a virtual ceremony — joining over 100 inspirational Californians previously inducted for embodying the state's innovative spirit.
The California Hall of Fame 16th Class inductees are:
• Carrie Fisher: Actress and screenwriter; • Maggie Gee: Pilot and physicist; • Etta James: Singer; • José Julio Sarria: LGBTQ rights activist and pioneer; • Vin Scully: LA Dodgers broadcaster; • Shirley Temple Black: Actress and public servant; • Archie Williams: Olympic gold medalist and educator.
“We are thrilled to announce the newest class of inductees joining some of our state's most revolutionary, innovative, and brightest in the California Hall of Fame,” said Gov. Newsom. “The outstanding legacy of this group has and will continue to embody what it means to be a Californian. There is no doubt their legacies will continue to live on and inspire millions across our state for generations to come.”
“The governor and I are delighted to honor the contributions of this remarkable group of visionaries,” said Siebel Newsom. “Each one of these pioneers has uniquely impacted California through their boundless creativity, perseverance, and courage — encapsulating the California dream through their lives and legacies."
“We are honored to join the Governor and First Partner in recognizing this extraordinary group of inductees. Through their talent, creativity and courage, they embody the best of California,” said California Museum Board of Trustees Chair Anne Marie Petrie.
Launched in 2006, the California Hall of Fame honors history-making Californians who embody the state's spirit of innovation and have changed the state, the nation, and the world.
Inductees are selected annually by the Governor and First Partner for achievements in arts, business and labor, entertainment, food and wine, literature, music, public service, science, and sports.
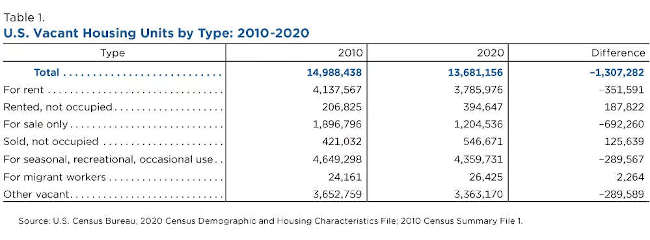
When many people think of vacant homes, they think of houses or apartments on the market for sale or rent. But the largest category of vacant housing in the United States is classified as “seasonal, recreational or occasional use,” commonly referred to as seasonal units.
These vacant structures cover a wide range of housing units, from part-time residences and hunting cabins to beach houses and timeshares.
As the nation recovered from the 2007-2008 housing crisis, the vacancy rate decreased from 11.4% in 2010 to 9.7% in 2020, according to 2020 Census Demographic and Housing Characteristics data released today.
The number of units for rent, units for sale, seasonal units and units that were in the vacant for some other reason category all declined during this period.
Despite that decline, there were still over 4.3 million vacant seasonal units throughout the country and seasonal units were once again the largest category of vacant housing (Table 1).
The term “seasonal vacant” covers a wide swath of potential situations, so it’s not surprising such vacancies were found in every county in the country.
But while everywhere, seasonal vacants were more common in certain places.
In 645 of the nation’s 3,143 counties, seasonal units made up at least 50% of the vacant housing in the county. In 1,313 counties, seasonal units outnumbered the combined total number of units for rent or sale that were vacant.
While these counties included areas typically known as vacation or second-home destinations, they also included some of the country’s most populous areas.
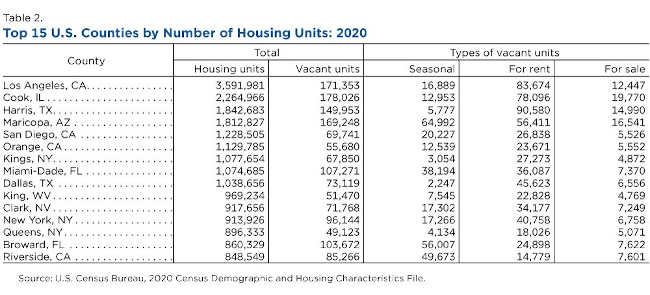
Among the 15 largest counties by number of housing units, 11 had many more vacant units listed for rent than for any other vacant category, including New York County, New York; Harris County, Texas; Cook County, Illinois; and Los Angeles County, California (Table 2).
However, Riverside County, California; Broward County and Miami-Dade County, Florida; and Maricopa County, Arizona, had more vacant units that were for seasonal, recreational or occasional use than vacant units for rent or for sale.
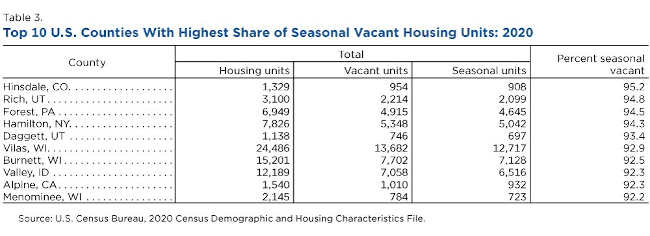
There were also 20 counties where over 90% of the vacant units were seasonal, including six in Wisconsin (Vilas, Burnett, Menominee, Florence, Sawyer, Oneida counties) and three in Colorado (Hinsdale, Mineral and Grand counties) (Table 3).
All 20 of these counties also had vacancy rates much higher than the national rate of 9.7%; all but six had a vacancy rate over 50%.
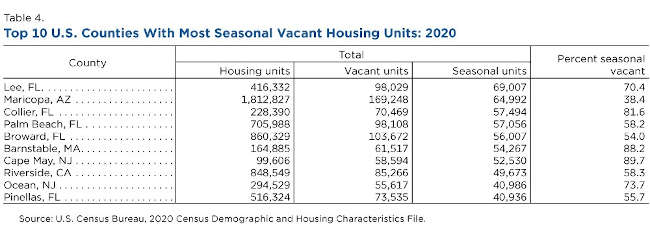
The counties with the largest total number of seasonal units were in seasonal destinations, such as beach towns and ski resort areas.
Five of the top 10 counties were in Florida and two others were in New Jersey. Maricopa County and Riverside County were the only counties in the top 10 not located along a coast (Table 4).
Despite the name, seasonal units cover a wide range of housing, including part-time snowbird housing in Maricopa County; second homes in New York County; hunting cabins in Vilas County, Wisconsin; and beach houses in Cape May County, New Jersey.
While it might seem complicated, the Census Bureau provides guidance to determine if a housing unit is vacant and, if so, how it should be classified.
The decennial census is the primary source of information on the type of vacant housing in your neighborhood but it’s not the only one. The Census Bureau’s Housing Vacancy Survey and American Community Survey monitor trends in vacant housing on a more frequent basis.
Evan Brassell is chief of the Housing Statistics Branch in the Social, Economic and Housing Statistics Division.
Arielle Kuperberg, University of North Carolina – Greensboro and Joan Maya Mazelis, Rutgers University
A new study found that those with student loans are more likely to delay medical, dental and mental health care. PeopleImages/iStock via Getty Images
The Research Brief is a short take about interesting academic work.
The big idea
Students who took out loans to pay for college rated their overall health and mental health as being worse than those who didn’t take out student loans. They also reported more major medical problems and were more likely to report delaying medical, dental and mental health care and using less medication than the amount prescribed to save money.
We reported these findings in an article published in the Journal of American College Health. The findings are based on surveys collected in 2017 from over 3,200 college students at two public universities in the United States.
We asked students to rate their physical and mental health on a 4-point scale – excellent, good, fair and poor. We also asked if they had experienced any major medical problems in the past year or whether they had ever postponed medical, dental or mental health care to make ends meet since starting college. Those who indicated they were taking regular medication for physical health problems, such as for asthma or high blood pressure, were asked if they ever took less medication than prescribed to save money.
Students with loans reported worse outcomes than those without loans, even after accounting for differences between them in terms of race, age and gender, as well as their parents’ education level and marital status.
Despite their worse self-reported mental health, students with loans were equally likely as students without loans to have received a new mental health diagnosis or treatment for a mental disorder in college. They also were equally likely to have visited a mental health practitioner in the past year or to use mental health medication. But they were almost twice as likely as those without debt to report delaying mental health care.
Why it matters
Our findings suggest that student loans may have hidden costs in the form of worse physical and mental health, more medical problems and diminished use of medical and mental health care. Stress from student loans can affect students while they are still in college, harming both mental and physical health.
College students are often at a crucial juncture when they are first leaving their parents’ home and establishing habits – such as those related to medical and dental care – that may persist beyond college. Declining to seek medical care can result in worse medical problems, potentially leading to diminished health and shorter lives for college graduates with loans.
One of the advantages of getting a college degree is improvedhealth. But students who take out loans to attend college may not see those benefits, especially if they defer medical care or use less medicine to save money.
We are writing a book that explores how debt affects life after college, including the consequences for health, housing, romantic relationships and career trajectories. So far, we have found that inequalities in health and delays in doctor visits persist after graduation. We have also found that college graduates who put off doctor visits to save money in college were a little over twice as likely to experience a recent major medical problem 15 months and 3.5 years after graduation. We also found they were over four times as likely to be be putting off medical care to save money after graduation, showing these habits persist well after they leave college.
Andrew King, The University of Melbourne; Ed Hawkins, University of Reading; Hunter Douglas, Te Herenga Waka — Victoria University of Wellington, and Luke Harrington, University of Waikato
Earth is warming and the signs of climate change are everywhere. We’ve seen it in the past few weeks as temperatures hit record highs around the world – both in the Northern Hemisphere and the warm Australian winter.
Global warming is caused by humanity’s greenhouse gas emissions, which continue at near-record pace. These emissions are predominantly generated by people in the world’s wealthiest regions.
Our world-first analysis, published today, examines the experience of global warming over the lifetimes of people around the world: young and old, rich and poor. We sought to identify who has perceived warmer temperatures most keenly.
We found middle-aged people in equatorial regions have lived through the most perceptible warming in their lifetimes. But many young people in lower-income countries could experience unrecognisable changes in their local climate later in life, unless the world rapidly tackles climate change.
Measuring the climate change experience
We examined temperature data and population demographics information from around the world.
Key to our analysis was the fact that not all warming is due to human activity. Some of it is caused by natural, year-to-year variations in Earth’s climate.
These natural ups and downs are due to a number of factors. They include variations in the energy Earth receives from the sun, the effects of volcanic eruptions, and transfers of heat between the atmosphere and the ocean.
This variability is stronger in mid-to-high-latitude parts of the world (those further from the equator) than in low-latitude areas (in equatorial regions). That’s because the weather systems further away from the equator draw in hot or cold air from neighbouring areas, but equatorial areas don’t receive cold air at all.
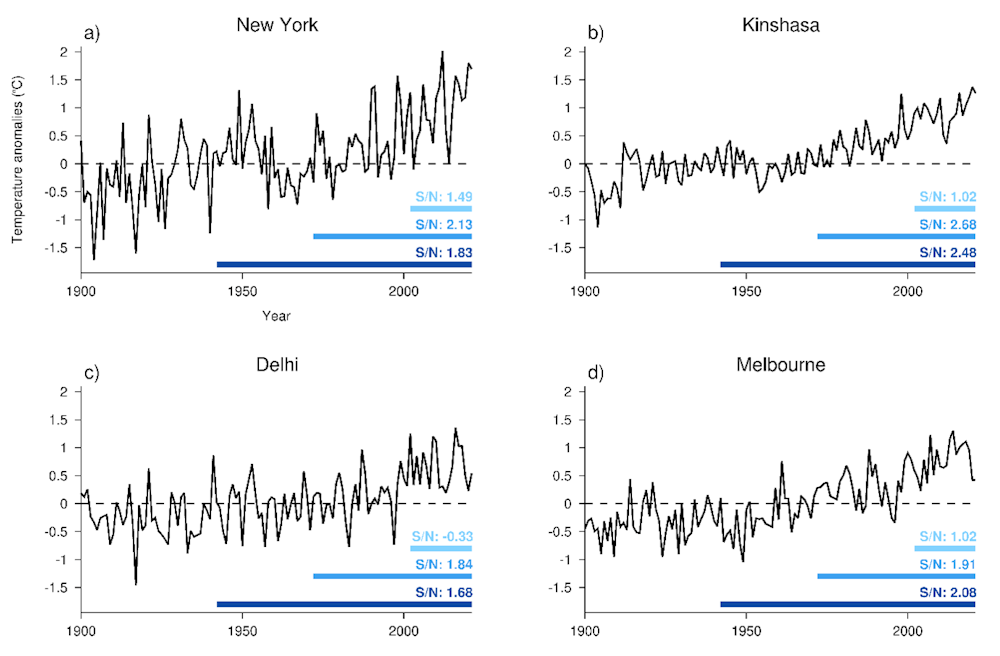
That’s why, for example, the annual average temperature in New York is naturally more variable than in the city of Kinshasa (in the Democratic Republic of Congo).
To account for this, we applied what’s known as the “signal-to-noise ratio” at each location we studied. That allowed us to separate the strength of the climate change “signal” from the “noise” of natural variability.
Making this distinction is important. The less naturally variable the temperature, the clearer the effects of warming. So warming in Kinshasa over the past 50 years has been much more perceptible than in New York.
Our study examined two central questions. First, we wanted to know, for every location in the world, how clearly global warming could be perceived, relative to natural temperature variability.
Second, we wanted to know where this perceived change was most clear over human lifetimes.
Annual-average temperatures at four major cities with signal-to-noise ratios shown for 20, 50 and 80 years up to 2021.Author provided
Our results
So what did we find? As expected, the most perceptible warming is found in tropical regions – those near the equator. This includes developing parts of the world that constitute the Global South – such as Africa, Latin America and the Caribbean, and Asia.
Household incomes in the Global South are typically lower than in industrialised nations (known as the Global North). We might, then, conclude people in the poorest parts of the world have experienced the most perceptible global warming over their lifetimes. But that’s not always the case.
Why? Because most parts of the Global South have younger populations than wealthier regions. And some people under the age of 20, including in northern India and parts of Sub-Saharan Africa, haven’t experienced warming over their lifetimes.
In these places, the lack of recent warming is likely down to a few factors: natural climate variability, and the local cooling effect of particles released into the atmosphere from pollution and changes in land use.
There’s another complication. Some populated regions of the world also experienced slight cooling in the mid-20th century, primarily driven by human-caused aerosol emissions.
So, many people born earlier than the 1950s have experienced less perceptible warming in their local area than those born in the 1960s and 1970s. This may seem counter-intuitive. But a cooling trend in the first few decades of one’s life means the warming experienced over an entire lifespan (from birth until today) is smaller and less detectable.
So what does all this mean? People in equatorial areas born in the 1960s and 1970s – now aged between about 45 and 65 – have experienced more perceptible warming than anyone else on Earth.
Our findings also raise significant issues of fairness and equity.
Humanity will continue to warm the planet until we reach global net-zero emissions. This means many young people in lower-income countries may, later in life, experience a local climate that is unrecognisable to that of their youth.
Of course, warming temperatures are not the only way people experience climate change. Others include sea-level rise, more intense drought and rainfall extremes. We know many of these impacts are felt most acutely by the most vulnerable populations.
Cumulative greenhouse gas emissions are much higher in the Global North, due to economic development. To address this inequality, rich industrialised nations must take a leading role in reducing emissions to net-zero, and helping vulnerable countries adapt to climate change.
Government funding helped keep U.S. charities afloat during the first six months of the COVID-19 pandemic, according to a study I conducted with Stephanie Karol, a fellow economist.
We found that charitable donations declined by more than an estimated 20% during that period – which preceded a sharp end-of-year upswing in giving in late 2020. But the government grants to nonprofits, which soared during those six months by over 65%, and the Paycheck Protection Program – a government-run loan program established to support employers as the pandemic upended the economy – enabled many charities to retain their employees.
The pandemic hindered many donors’ ability to give, while also hampering the delivery of charitable services when nearly all indoor activities screeched to a halt. After analyzing data we obtained from the Internal Revenue Service and the Small Business Administration, another government agency, we found that when donations declined, from March to November 2020, charities spent less delivering their services. Spending by charities fell by 34%, as many of those groups struggled to keep going.
We found that nonprofit employment also suffered. The number of nonprofit jobs declined by 14%, and wages for the people charities employed fell by over 40% on average during this period of high U.S. unemployment. The arts were particularly hard-hit, with donations, spending on programs, salaries and other forms of employee compensation all falling by roughly 50% as museums, theaters and concert venues remained shut and in-person shows were canceled.
By contrast, the data we analyzed indicates that social service charities, such as homeless shelters and hospices, fared relatively well, with private contributions and employment remaining stable, and spending on programs and employee compensation declining by less than 20%. That was the smallest decline compared with other kinds of charities.
At the same time, many governments around the world stepped in to provide additional support to businesses and nonprofits alike. In the United States, government grants to charities increased significantly, and Paycheck Protection Program loans, most of which were later converted into grants that borrowers didn’t need to pay back, helped to cushion economic blows. We calculated that the PPP saved more than 450,000 nonprofit jobs in those initial six months.
All told, the PPP saved between 1.4 and 2 million jobs in its first year, according to a study by MIT economist David Autor and his co-authors. Our estimates imply that between 23% and 33% of jobs saved by the Paycheck Protection Program were in the nonprofit sector.
Why it matters
Our results suggest that the Paycheck Protection Program was a particularly helpful lifeline for nonprofits, which constitute a large segment of the U.S. economy. Nonprofit employees make up roughly 10% of the U.S. labor force.
By helping nonprofits keep their operations running, this funding may have prevented an even larger reduction in spending on the many services charities provide.
As far as we’re aware, our study is the first to assess the economic impact of the pandemic on the entire nonprofit sector in the United States.
What still isn’t known
Given delays in data availability, we focused on the first six months of the COVID-19 pandemic. A lot has changed since late 2020 in terms of economic conditions and the way nonprofits adapted to the pandemic.
Data in the annual Giving USA report shows that U.S. charitable donations overall remained stable in 2021 before declining in 2022 because of inflation and stock market declines.
We believe further research is needed to determine how changes in the scale of donations, combined with a relatively brief surge in government support, affected the delivery of nonprofit services.
The Research Brief is a short take about interesting academic work.
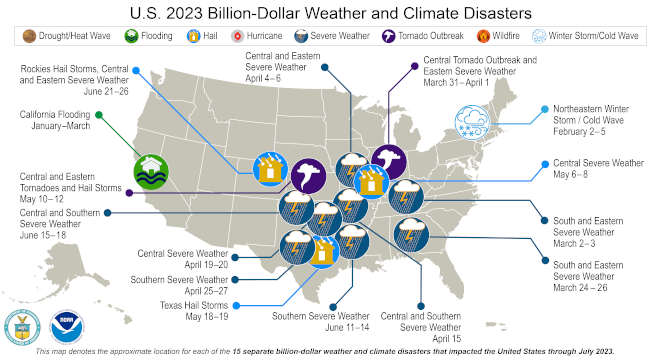
A map of the U.S. plotted with 15 weather and climate disasters each costing $1 billion or more that occurred between January and July, 2023. (Image credit: NOAA/NCEI)
July 2023 was a hot and stormy month for the U.S., with flooding rain and scorching temperatures impacting much of the nation.
The year 2023 is also marked by the most billion-dollar disasters for the first seven months of any year since 1980, according to scientists from NOAA’s National Centers for Environmental Information.
Below are more takeaways from NOAA’s latest monthly U.S. climate report:
Climate by the numbers
July 2023
The average temperature across the contiguous U.S. last month was 75.7 degrees F (2.1 degrees above average), with July 2023 ranking as the 11th-hottest July in the 129-year climate record.
Arizona, Florida, Maine and New Mexico had their warmest Julys on record, while an additional 13 states saw their top-10 warmest July on record.
The average July precipitation was 2.70 inches (0.08 of an inch below average), ranking in the middle third of the historical record.
Arizona, Idaho and Minnesota each had their third-driest July on record, while California and New Mexico had one of their top-10 driest Julys on record. Connecticut and Vermont experienced their second-wettest July on record. Massachusetts, Michigan, New Hampshire, New York, Oklahoma, Pennsylvania and Rhode Island all had a July ranking among top-10 wettest on record.
Year to date (YTD, January through July 2023)
The YTD average temperature for the contiguous U.S. was 53.0 degrees F (1.7 degrees above average), ranking as the 16th-warmest such YTD on record.
Florida recorded its warmest such YTD, while Connecticut, Delaware, Louisiana, Maryland, Massachusetts, Mississippi and New Jersey each ranked second-warmest for the January–July period. An additional 20 states had a top-10 warmest such YTD period while no state experienced a top-10 coldest YTD for this seven-month period.
The average precipitation for January-July 2023 was 18.41 inches (0.32 of an inch above average), ranking in the middle third of the record.
New Hampshire had its fifth-wettest such YTD on record, while Massachusetts and Vermont ranked among their top-10 wettest for this period. Conversely, precipitation was below average across parts of the Northwest, eastern Plains, Southwest, central Mississippi Valley, Mid-Atlantic and along parts of the Gulf during the January–July period. Maryland had its 10th-driest January–July on record.
Billion-dollar disasters
There have been 15 individual weather and climate disaster events confirmed for January through July 2023, each with losses exceeding $1 billion. This is the highest number of billion-dollar disasters ever recorded for the first seven months of a year since NOAA began tracking these events in 1980.
The 15 events include:
• 13 severe weather events. • One winter storm event. • One flooding event.
These events caused 113 direct and indirect fatalities and produced more than $39.7 billion in damages (Consumer Price Index (CPI)-adjusted).
Since 1980, the U.S. has sustained 363 separate weather and climate disasters where overall damages/costs reached or exceeded $1 billion (including CPI adjustment to 2023). The total cost of these 363 events exceeds $2.590 trillion.
Other notable highlights from this report
Record heat scorched the Southwest in July:
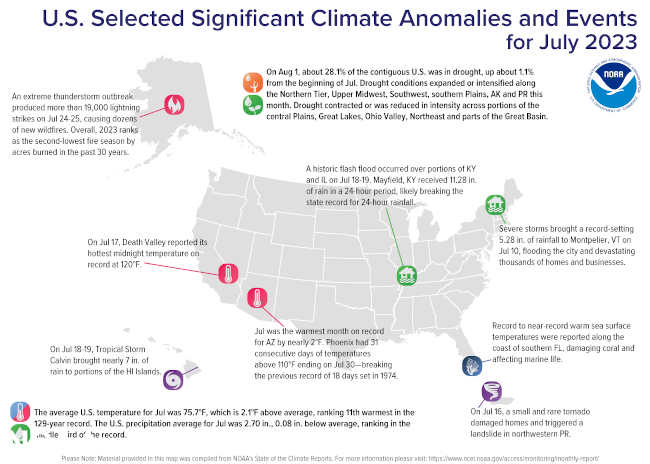
• July was the warmest month on record for the state of Arizona and New Mexico by nearly 2 degrees F. Across the Southwest, 36 counties each had their warmest July on record, while an additional 63 counties ranked in the top-10 warmest for the month. • Phoenix, Arizona, had an average temperature of 102.8 degrees F for the month of July — the hottest month on record for any U.S. city. Contributing to the record, Phoenix had 31 consecutive days of temperatures above 110 degrees F from June 30 to July 30 — breaking the previous record of 18 days set in 1974. • On July 16, California’s Death Valley soared to 128 degrees F, setting a daily-temperature record, and reported its hottest midnight temperature on record at 120 degrees F on July 17.
Severe storms, catastrophic flooding struck some communities: • On July 10, severe storms brought devastation and flooding to portions of the Northeast, as areas reported up to eight inches of rain within a 24-hour period. Montpelier, Vermont, received a record-breaking 5.28 inches of rain, flooding the city and damaging thousands of homes and businesses. • From July 18-19, a historic flash flood occurred over portions of Kentucky and Illinois after some areas received up to 12 inches of rainfall, causing significant damage and trapping residents in their homes. Mayfield, Kentucky, received 11.28 inches of rain in a 24-hour period, likely breaking the state record for 24-hour rainfall. • From July 24-25, an extreme thunderstorm outbreak produced more than 19,000 lightning strikes causing dozens of new wildfires in the state of Alaska. Overall, 2023 ranks as the second-lowest fire season, by acres burned, in the past 30 years for the state.
A map of the U.S. plotted with significant climate events that occurred during July 2023. Please see article text below as well as the full climate report highlights at http://bit.ly/USClimate202307. (Image credit: NOAA/NCEI)
LAKE COUNTY, Calif. — The Board of Supervisors is set to consider a contract with a Public Health officer candidate and support for the expansion of the area’s National Monument.
The board will meet beginning at 9 a.m. Tuesday, Aug. 15, in the board chambers on the first floor of the Lake County Courthouse, 255 N. Forbes St., Lakeport.
The meeting ID is 990 1778 2374, pass code 737235. The meeting also can be accessed via one tap mobile at +16694449171,,99017782374#,,,,*737235#.
All interested members of the public that do not have internet access or a Mediacom cable subscription are encouraged to call 669-900-6833, and enter the Zoom meeting ID and pass code information above.
On the agenda is an employment agreement between the county of Lake and Noemi C. Doohan, MD, the former Public Health officer of Mendocino County who now is serving as chief medical officer for the Santa Barbara County Public Health Department.
The contract is in the annually renewable not-to-exceed amount of $290,000, plus employee benefits.
In an item timed for 9:45 a.m., the board will consider a resolution supporting the addition of Molok Luyuk (Condor Ridge) to the Berryessa Snow Mountain National Monument.
The full agenda follows.
CONSENT AGENDA
5.1: Sitting as the Lake County Air Quality Management District Board of Directors, consideration of memorandum of understanding by and between county of Mendocino and the Lake County Air Quality Management District for air pollution control officer duties, effective Aug. 1, 2023.
5.2: Adopt resolution approving agreement with California Department of Food Agriculture for Certified Farmer’s Market Program Investigation and Enforcement Agreement No. 23-0040-000-SA in the amount of $1,140 for the period of July 1, 2023, through June 30, 2024.
5.3: Adopt resolution to amend Resolution No. 2023-77, that increased revenue in Fund 200, Lake County Watershed Protection District to appropriate unanticipated revenue.
5.4: Approve agreement between county of Lake and Santa Rosa Behavioral Healthcare Hospital for acute inpatient psychiatric hospital services and professional services associated with acute inpatient psychiatric hospitalizations in the amount of $50,000 for fiscal year 2023-24 and authorize the board chair to sign.
5.5: Approve Board of Supervisors minutes for Aug. 3 and Aug. 8, 2023.
5.6: Approve purchase orders for the purchase of six (6) vehicles for the central garage fleet and authorize the Public Works director/assistant purchasing agent to sign the purchase orders.
5.7: Adopt resolution authorizing the Public Works director to sign the notice of completion for the Cooper Creek at Witter Springs Road Bridge Replacement Project in Lake County; Federal Project No. BRLO-5914(078) Bid No. 22-03.
5.8: Approve the Sun Ridge Systems software support services agreement for the FY 2023/24 in the amount of $ 52,626 for the support of its law enforcement software suite, and authorize the sheriff to issue a purchase order.
5.9: Sitting as the Board of Directors of the Lake County Watershed Protection District, a) waive the formal bidding process, pursuant to Lake County Code Section 38.2 (2) & (3), as competitive bidding is not in the public interest due to the unique nature of the goods and services provided and the bidding process would produce no economic benefit; and b) approve agreement with Alpha Analytical Laboratories Inc. for water and sediment sampling in the amount of $100,000 and authorize the Water Resources director to sign the agreement.
TIMED ITEMS
6.2, 9:07 a.m.: Pet of the Week.
6.3, 9:10 a.m.: Consideration of the June 30, 2023, report of Lake County pooled Investments.
6.4, 9:45 a.m. Consideration of a resolution supporting the addition of Molok Luyuk (Condor Ridge) to the Berryessa Snow Mountain National Monument.
UNTIMED ITEMS
7.2: Consideration of an employment agreement between the county of Lake and Noemi C. Doohan, MD, PhD, MPH, for Public Health officer services in the annually renewable not-to-exceed amount of $290,000, plus employee benefits (item will be taken up following Closed Session Item 8.2).
7.3: Consideration of updated applicant interview travel expense reimbursement policy.
CONSENT AGENDA
8.1: Public employee appointment pursuant to Gov. Code Section 54957(b) (1): Interviews for chief public defender and appointment of chief public defender.
8.2: Public employee appointment pursuant to Gov. Code Section 54957(b) (1): Interviews for Public Health officer and appointment of Public Health officer.
8.3: Conference with legal counsel: Decision whether to initiate litigation pursuant to Gov. Code Sec. 54956.9(d)(4): One potential case.
8.4: Conference with legal counsel: Existing litigation pursuant to Gov. Code sec. 54956.9 (d)(1) - FERC Project No. 77, Potter Valley Hydroelectric Project.
8.5: Public employee discipline/dismissal/release.
Email Elizabeth Larson at This email address is being protected from spambots. You need JavaScript enabled to view it.. Follow her on Twitter, @ERLarson, or Lake County News, @LakeCoNews.
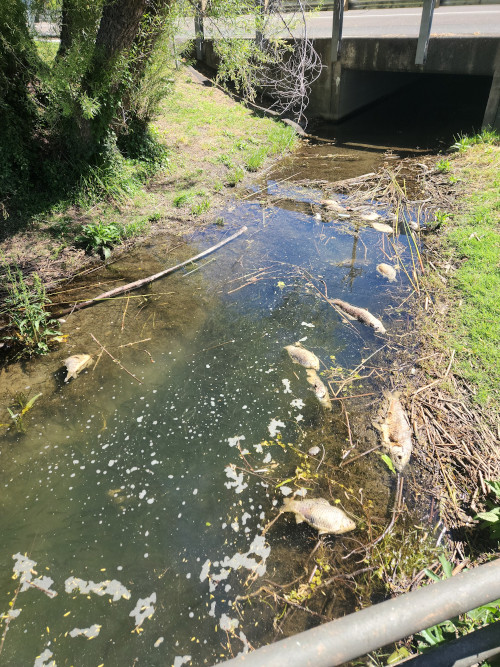
A small bass fish kill, off Lakeport in August, resulted from catch and release fishing during extreme warm weather. These types of fish kills don’t impact large numbers of fish, but generally larger members of the population are commonly included. Dear Lady of the Lake,
Every summer I come up to Clear Lake to go fishing. This year, I noticed a bunch of dead fish in the northern part of the lake. Do you know what is causing this fish kill and if this is a “new normal” for Clear Lake?
Thank you, — Catfishin’ Carl
Figure: A small bass fish kill, off Lakeport in August, resulted from catch and release fishing during extreme warm weather. These types of fish kills don’t impact large numbers of fish, but generally larger members of the population are commonly included.
Dear Carl,
Thank you for this important and relevant question. I have received several calls, emails and face-to-face questions about the fish die-offs that occurred this year in Clear Lake. This is a great topic to discuss in today’s column.
Unfortunately, fish die-offs are normal for lakes that have healthy and abundant fish populations, like Clear Lake.
Healthy lakes that have abundant fish populations are rich in fish food, including small insects (called zooplankton) and green algae (called phytoplankton), which is the base of the food web.
Clear Lake, as we all are familiar, is very rich with phytoplankton and has a very large food web base. That is why the fishing here is so plentiful.
In these types of “fish” lakes, fish are pretty much growing and dying all the time, and the majority of the dead fish bodies sink and decompose on the bottom of the lake and never float back to the surface.
Sometimes gasses get trapped or are produced from the decomposition process and gasses cause the fish carcass to float. Then due to currents, winds, and waves, we will sometimes witness the sad and stinky event of a fish die-off.
Sometimes fish die-offs are completely natural, and sometimes they are triggered by an external, or man-made event. There are technically two different names for these types of events.
Fish mortality events: Fish kills vs. fish die-offs
Although these terms are confused quite a bit, by laymen and professionals alike, there actually is a dictionary-difference between a “fish-kill” and a “fish die-off.”
A “fish-kill” is an event that leads to small or large fish mortality from a human-caused specific incident such as an oil or sewer spill or a point source dumping of contaminants. Most fish-kills that are naturally occurring are actually die-offs, but get mistaken for fish-kills.
As opposed to fish-kills, a “fish die-off” is generally a naturally occuring phenomena and usually occurs in summer when low oxygen and warm temperatures causes large mortality in a localized population of fish. Fish die-offs can also happen in winter months when temperature stress can kill a fish population.
Here in Lake County, we have seen winter die-offs happen during extreme winters here in Clear Lake and her tributaries, especially to the fragile, small bait fish populations like the threadfin shad and silversides.
Lastly, a “fish mortality event” can be a good term that is inclusive of both of these occurrences. Just by observation, we might not know what is the cause of a fish-kill or fish die-off, and sometimes an investigation is warranted.
Now, an alarming fish mortality event would include many fish of various sizes and species. That type of event would indicate a potential fish-kill incident and a thorough investigation by a state or public health agency would be extremely warranted.
If something in the aquatic environment is causing that level of broad mortality, then there is a high probability that other uses and users could be impacted, such as drinking water treatment processes or exposure through recreation. Likewise, when there is a contaminant spill or leak incident, one of the most important monitoring requirements is any observations of fish-kills or other impacts to wildlife.
Investigating fish mortality events
In general, a fish mortality event that is in need of reporting and investigating would include the death of at least 50-100 fish, or more. Basically, if there is one or two fish, of different species or sizes, belly up in the middle of the lake, there is no need to panic and report a fish mortality event.
Sometimes, especially in the warmer seasons, fish can become extremely stressed after being caught by a fisherman. Sometimes after a fish is kept in a warm live-well or bucket for a long time during the summer, they succumb to the stress and can die, so this can also lead to some of the “belly-ups” sometimes observed around the lake.
It’s important that fishers, during warm summer months, take extreme care of fish that they catch and don’t release right away. The California Department of Fish and Wildlife (CDFW) imposes fishing tournament restrictions in the height of summer, to prevent game fish from becoming too stressed or over-fished when the temperatures are extremely warm.
These restrictions include reduced hours between blast-off and weigh-ins, requirements to report mortalities, and general reductions in the number and species type of permits issued during any one week or weekend.
It’s important for visiting and residential fishermen to practice the methods necessary to protect game fish during warm weather. A great resource for useful tools and strategies are online fishing blogs and magazines. According to Bass West Magazine and BassResource.com, the key to reducing fish mortality is responsible anglers.
Obviously, not all fish kills are the result of fishing. Usually fishing related kills are minimal, and don’t impact more than 5-20 fish. Of course angler-related fish-kills are limited in size and species of fish, and pretty easy to identify. If the fish kill consists of several large, prize game fish, all of one species, and localized to one area, then it's highly likely that its probably an angler or fishing tournament related.
Angler and tournament fish kills are rare because CDFW permit requirements are structured to prevent fish mortality and tournaments are usually accompanied by CDFW oversight, such as a on-site regional biologist, game warden, or local fishing club members that provide observance or support to prevent fish mortality.
When the fish mortality event is not related to fishing, it’s key to investigate the size and species of fish impacted. If the event only includes similarly sized fish of one species, that could indicate a specific type of die-off. A good example of this is when abnormal or wild weather fluctuations in spring cause spawning stress die-offs for species like sunfish, pumpkinseeds, or crappie.
Additionally, if a fish is carrying an additional burden of a sickness, parasite, or malnutrition, then any type of external stress could lead to dead fish. If a sickness, virus, or parasite is impacting a population of one species of fish, then a fish kill can result if there is any additional environmental stressor, either natural or man-made.
Interaction of disease and weather can lead to fish mortality events
Earlier this year in June (2023) there was a mass carp die-off throughout the northern part of the Upper Arm of Clear Lake. Shoreline property owners along North Lakeport, Nice, and Lucerne found their shorelines littered with large, stinky, slimy, rotting carp bodies (cue the gross!).
After notification to the CDFW Mortality Lab state personnel collect dead fish specimens to identify possible causes of the event. Of the five carp samples collected and evaluated, five of the five samples were positive for koi herpesvirus (KHV) also known as cyprinid herpesvirus 3 (CyHv3).
Cyprinis herpesvirus effects only koi and common carp fish species. KHV is highly contagious and affects younger carp more than older members of the population, but death is almost certain once contracted. Most importantly is that warm temperatures can increase mortalities in a population suffering from KHV.
In Clear Lake, we have a very healthy and robust carp and goldfish population. In general, carp are considered an invasive species; they can grow rapidly, reproduce several times throughout the year, consume native plants and animals, and out compete desirable native fish species.
When populations of fish increase, and many fish are living closely within the same space, disease can spread easily. For carp, mating is an active and boisterous event, so the chance of spreading a highly contagious disease, like KHV, is high.
The large carp die off earlier this year resulted from too many members within a population, having just closely interacted due to mating season, and a sharp increase in water temperatures as the season moved from spring to summer, causing stress to fish that were already compromised from the KHV.
In this instance the combination of environmental conditions and disease caused a fish die-off mortality event, but that was only able to be ascertained through laboratory analysis and study of the collected fish tissues.
Sometimes mortality events happen, where the cause cannot be as easily identified, but could result from natural causes.
Carp die off due to Koi Herpes Virus causing carp to float to shorelines and creek mouths throughout spring in Clear Lake 2023. Pictures here, at the mouth of Lucerne Harbor Creek, about 15 large carp created unsightly conditions and distinctive foul smells. Photo: A. De Palma-Dow. Impacts to fishing
In general, unless there is a wide spread disease or climatic event (i.e.drought), fishing in Clear Lake will remain strong, with normal ebbs and flows, that are mostly season related, as populations go through normal booms and busts. To answer your question Carl, the “normal” for Clear Lake is some years there are fish die offs or fish kills, but many years there are not.
However, Clear Lake is consistently a strong contender for being rated one of the best bass fishing lakes in the west. In fact, for 2023, Clear Lake was rated third for the top 10 Best Bass Lakes of 2023 by Bassmaster.
Fish in Clear Lake are generally very healthy, and rarely do large scale diseases break out and impact whole populations. This is due to the fact that Clear Lake is huge and is highly productive, so it can provide the food and resources needed for fish to grow and be healthy.
For more information on specific diseases impacting fish, such as viruses other than KVH, fungus, and parasites, I will refer you to the comprehensive “Field Manual for Investigation of Fish Kills” edited by Meyer and Barclay in 1990 and produced by the US Fish and Wildlife Service. This manual can be found for free download at the USGS publications warehouse online here.
Natural causes of fish kill
One of the most natural causes for fish kill is oxygen depletion. When the demand for oxygen by fish, and all the other organisms living in the water, exceeds the oxygen that is available, or being held by the water, then there can be fish kills.
Some fish have been able to swim to other areas where more oxygen is present, like deeper, cooler waters in the lake. If we remember our basic chemistry, warmer water holds less oxygen while cooler water holds more oxygen. Likewise, fish metabolism requires less oxygen in cooler waters than in warmer waters. Some fish are more suited for life in cooler waters, and some are more tolerant in warmer waters.
For example, bass are cooler water fish, and require more oxygen, and tend to swim down to the deep parts of the lake in the height of the summer, while catfish and carp are more tolerant of warmer water, with less oxygen, and can be found in the shallows all throughout the year.
When we talk about low oxygen, a threshold that can become fatal for fish is 0 or 1 parts per million (ppm, or milligrams per liter, mg/L). Anoxic conditions are when the water has absolutely no oxygen (0 ppm) and hypoxic is when there is very, very low oxygen conditions (2ppm or less).
Some size and species of fish become extremely stressed when water around them becomes hypoxic, and the majority of fish cannot survive in even short time periods of anoxic conditions.
Large declines in oxygen can occur after a period of rapid growth, such as a warm period where large amounts of aquatic plants and algae grow. During this growth the plants are actually creating oxygen, since they photosynthesize. They take in carbon dioxide and transpire oxygen.
When it’s nighttime, and the sun is absent, the plants will switch from producing oxygen to consuming oxygen, as they respire they take in oxygen and release carbon dioxide. This is called cellular respiration, and green living things need to respire to balance carbon within individual cells and maintain growth of tissues.
This period of respiration can last into the morning for a few hours, until the sun and temperature reach an optimal temperature for the plant to fully switch to photosynthesize. During this time, the oxygen concentrations are extremely low in the water surrounding thick and heavy aquatic plant beds, and any fish living within these areas might be having a hard time breathing.
If too many fish, and other aquatic organisms are present, the demand for oxygen might exceed the supply, and a fish die-off can occur.
This die-off event can literally take place overnight. Lake shoreline property owners might wake up one morning to see fish bodies, of all sizes and species, bobbing around their dock or washed up on their shoreline.
Sometimes smaller fish can survive this type of fish-die off since their oxygen requirements are lower than larger fish, and some species of fish are successful in swimming out of the area to a place with more oxygen.
However, like in Clear Lake, some shallow areas of the Upper Arm, are very large, shallow, and the expanse of thick aquatic plant beds comprises hundreds of acres.
Unfortunately, during this time in the season when plants and algae are heavily growing, the temperature is simultaneously increasing. Fish can become stressed under warmer water temperatures, and can sometimes become trapped between layers of low oxygen in the bottom parts of the lake and the warm layers encroaching from the surface.
I wrote in detail about this phenomena in my column from August 2021 “Figuring out Fish Kills” but this can be described as a thermal squeeze sandwich and can lead to non-discriminate fish kills.
Reporting fish mortality events
We all need to do our part to report fish mortality events. Both the state and the County rely on citizen reports to initiate response, monitoring and investigations.
Next time you see one dead fish, look around and see if you see any more. Note if they are the same size or the same species. Submit a report to the CDFW mortality lab here, or you can call the CDFW mortality lab at the State Wildlife Health Lab, 916-358-2790.
A local reporting tool has been created, accessed through iNaturalist smart phone application and called the https://” <https://www.inaturalist.org/projects/clear-lake-fish-kill-monitoring-project> Clear Lake Fish Kill Monitoring Project”. This was created by the Big Valley EPA. The “Clear Lake Fish Kill Monitoring Project'' is a citizen science project to record fish kills wherever they occur on Clear Lake and nearby tributaries.
This project contributes to ongoing data collection and environmental monitoring efforts by the Big Valley Band of Pomo Indians EPA Office in collaboration with local, state, regional, and national agencies.” If you have iNaturalist on your phone or tablet, add this project and record any fish kills or other lake wildlife issues you spot out on the lake. You can also take photos and notes on location, size and species of fish, and submit to the project once you are off the water. https://www.inaturalist.org/projects/clear-lake-fish-kill-monitoring-project.
Sincerely
Lady of the Lake
Angela De Palma-Dow is a limnologist (limnology = study of fresh inland waters) who lives and works in Lake County. Born in Northern California, she has a Master of Science from Michigan State University. She is a Certified Lake Manager from the North American Lake Management Society, or NALMS, and she is the current president/chair of the California chapter of the Society for Freshwater Science. She can be reached at This email address is being protected from spambots. You need JavaScript enabled to view it..
A huge storm dominates the rather featureless surface of Saturn in an image taken by the Cassini spacecraft on Feb. 25, 2011, about 12 weeks after the powerful storm was first detected in the planet's northern hemisphere. The megastorm is seen overtaking itself as it encircles the entire planet. Astronomers have found deep in the atmosphere the aftereffects of megastorms that occurred hundreds of years ago. The dark stripes are the shadows of Saturn's rings. (NASA/JPL/Space Science Institute, PIA12826)
BERKELEY, Calif. — The largest storm in the solar system, a 10,000-mile-wide anticyclone called the Great Red Spot, has decorated Jupiter's surface for hundreds of years.
A new study now shows that Saturn — though much blander and less colorful than Jupiter — also has long-lasting megastorms with impacts deep in the atmosphere that persist for centuries.
The study was conducted by astronomers from the University of California, Berkeley, and the University of Michigan, Ann Arbor, who looked at radio emissions from the planet, which come from below the surface, and found long-term disruptions in the distribution of ammonia gas.
The study was published Aug. 11 in the journal Science Advances.
Megastorms occur approximately every 20 to 30 years on Saturn and are similar to hurricanes on Earth, although significantly larger.
But unlike Earth's hurricanes, no one knows what causes megastorms in Saturn's atmosphere, which is composed mainly of hydrogen and helium with traces of methane, water and ammonia.
“Understanding the mechanisms of the largest storms in the solar system puts the theory of hurricanes into a broader cosmic context, challenging our current knowledge and pushing the boundaries of terrestrial meteorology,” said lead author Cheng Li, a former 51 Peg b Fellow at UC Berkeley who is now an assistant professor at the University of Michigan.
Imke de Pater, a UC Berkeley professor emerita of astronomy and of earth and planetary sciences, has been studying gas giants for over four decades to better understand their composition and what makes them unique, employing the Karl G. Jansky Very Large Array in New Mexico to probe the radio emissions from deep inside the planet.
“At radio wavelengths, we probe below the visible cloud layers on giant planets. Since chemical reactions and dynamics will alter the composition of a planet’s atmosphere, observations below these cloud layers are required to constrain the planet’s true atmospheric composition, a key parameter for planet formation models,” she said. “Radio observations help characterize dynamical, physical and chemical processes including heat transport, cloud formation and convection in the atmospheres of giant planets on both global and local scales.”
As reported in the new study, de Pater, Li and UC Berkeley graduate student Chris Moeckel found something surprising in the radio emissions from the planet: anomalies in the concentration of ammonia gas in the atmosphere, which they connected to the past occurrences of megastorms in the planet’s northern hemisphere.
According to the team, the concentration of ammonia is lower at midaltitudes, just below the uppermost ammonia-ice cloud layer, but has become enriched at lower altitudes, 100 to 200 kilometers deeper in the atmosphere. They believe that the ammonia is being transported from the upper to the lower atmosphere via the processes of precipitation and reevaporation. What’s more, that effect can last for hundreds of years.
The study further revealed that although both Saturn and Jupiter are made of hydrogen gas, the two gas giants are remarkably dissimilar. While Jupiter does have tropospheric anomalies, they have been tied to its zones (whitish bands) and belts (darkish bands) and are not caused by storms like they are on Saturn.
The considerable difference between these neighboring gas giants is challenging what scientists know about the formation of megastorms on gas giants and other planets and may inform how they’re found and studied on exoplanets in the future.
The National Radio Astronomy Observatory (NRAO) is a facility of the National Science Foundation, operated under cooperative agreement by Associated Universities Inc.
Robert Sanders writes for the UC Berkeley News Center.
LAKEPORT, Calif. — The Lakeport City Council this week will meet the Lakeport Police Department’s new employees, consider agreements and an employee policy.
The council will meet at 6 p.m. Tuesday, Aug. 15, in the council chambers at Lakeport City Hall, 225 Park St.
The council chambers will be open to the public for the meeting. Masks are highly encouraged where 6-foot distancing cannot be maintained.
If you cannot attend in person, and would like to speak on an agenda item, you can access the Zoom meeting remotely at this link or join by phone by calling toll-free 669-900-9128 or 346-248-7799.
The webinar ID is 973 6820 1787, access code is 477973; the audio pin will be shown after joining the webinar. Those phoning in without using the web link will be in “listen mode” only and will not be able to participate or comment.
Comments can be submitted by email to This email address is being protected from spambots. You need JavaScript enabled to view it.. To give the city clerk adequate time to print out comments for consideration at the meeting, please submit written comments before 3:30 p.m. on Tuesday, Aug. 15.
On Tuesday the council will meet new Lakeport Police Department officers Austin Eldridge, Jonatan Moreno and Alexis Pizano, and Sgt. Sarah Hardisty, and the council also will present a proclamation recognizing Aug. 31, as International Overdose Awareness Day in the city of Lakeport.
The council is due on Tuesday to hold a public hearing and approve an ordinance adopting a policy for the use of military equipment by the Lakeport Police Department.
Under council business, City Manager Kevin Ingram will present to the council a memorandum of understanding between the city and the Lakeport Main Street Association for the period of July 1, 2023, through June 30, 2024.
Assistant City Manager Nick Walker will seek the council’s approval to execute a contract with R3 for consulting services and a reimbursement agreement with Lakeport Disposal.
Administrative Services Director/City Clerk Kelly Buendia will present a resolution establishing a policy and procedure governing limited term employees.
On the consent agenda — items considered noncontroversial and usually accepted as a slate on one vote — are warrants; minutes of the regular council meeting on Aug. 10; approval of Application 2023-022, with staff recommendations, for the 2023 Harvest Festival; receipt and filing of the Community Development Department activity report for fourth quarter of fiscal year 2022-23; and cancellation of the regular City Council meeting on Oct. 3 and approval of the participation of the city of Lakeport in the National Night Out event, with street closures and the Library Park Gazebo reserved for the event.
Email Elizabeth Larson at This email address is being protected from spambots. You need JavaScript enabled to view it.. Follow her on Twitter, @ERLarson, or Lake County News, @LakeCoNews.
LAKE COUNTY, Calif. — Lake County Animal Care and Control has new dogs and a puppy this week.
Dogs available for adoption this week include mixes of Anatolian shepherd, Belgian malinois, Chihuahua, collie, German shepherd, hound, husky, kelpie, mastiff, pit bull and terrier.
Dogs that are adopted from Lake County Animal Care and Control are either neutered or spayed, microchipped and, if old enough, given a rabies shot and county license before being released to their new owner. License fees do not apply to residents of the cities of Lakeport or Clearlake.
The following dogs at the Lake County Animal Care and Control shelter have been cleared for adoption.
Call Lake County Animal Care and Control at 707-263-0278 or visit the shelter online for information on visiting or adopting.
“Nova” is a 2-year-old female husky in kennel No. 2, ID No. LCAC-A-5005. Photo courtesy of Lake County Animal Care and Control. ‘Nova’
“Nova” is a 2-year-old female husky with a black and white coat.
She is in kennel No. 2, ID No. LCAC-A-5005.
This 1 and a half year old male Great Pyrenees is in kennel No. 3, ID No. LCAC-A-5469. Photo courtesy of Lake County Animal Care and Control.Male Great Pyrenees
This 1 and a half year old male Great Pyrenees has a white coat.
He is in kennel No. 3, ID No. LCAC-A-5469.
This 2-year-old male poodle is in kennel No. 4, ID No. LCAC-A-5541. Photo courtesy of Lake County Animal Care and Control. Male poodle
This 2-year-old male poodle has a black coat.
He is in kennel No. 4, ID No. LCAC-A-5541.
This 3-year-old male Anatolian shepherd-mastiff mix is in kennel No. 5, ID No. LCAC-A-5276. Photo courtesy of Lake County Animal Care and Control. Anatolian shepherd-mastiff mix
This 3-year-old male Anatolian shepherd-mastiff mix has a short fawn coat.
He is in kennel No. 5, ID No. LCAC-A-5276.
This 5-year-old male Chihuahua is in kennel No. 6, ID No. LCAC-A-5500. Photo courtesy of Lake County Animal Care and Control. Male Chihuahua
This 5-year-old male Chihuahua has a short tricolor coat.
He is in kennel No. 6, ID No. LCAC-A-5500.
“Roasie” is a 2-year-old female pit bull terrier in kennel No. 7, ID No. LCAC-A-5434. Photo courtesy of Lake County Animal Care and Control. ‘Roasie’
“Roasie”is a 2-year-old female pit bull terrier with a short black and white coat.
She is in kennel No. 7, ID No. LCAC-A-5434.
This 3-year-old female pit bull is in kennel No. 8, ID No. LCAC-A-5505. Photo courtesy of Lake County Animal Care and Control. Female pit bull
This 3-year-old female pit bull has a short brown coat.
She is in kennel No. 8, ID No. LCAC-A-5505.
This 3-year-old female pit bull terrier is in kennel No. 10, ID No. LCAC-A-5400. Photo courtesy of Lake County Animal Care and Control. Female pit bull terrier
This 3-year-old female pit bull terrier has a brown and white coat.
She is in kennel No. 10, ID No. LCAC-A-5400.
This 2-year-old female German shepherd is in kennel No. 12, ID No. LCAC-A-5488. Photo courtesy of Lake County Animal Care and Control. Female German shepherd
This 2-year-old female German shepherd has a black and tan coat.
She is in kennel No. 12, ID No. LCAC-A-5488.
This 2 and a half year old male shepherd is in kennel No. 14, ID No. LCAC-A-5479. Photo courtesy of Lake County Animal Care and Control. Male shepherd
This 2 and a half year old male shepherd has a short black and tan coat.
He is in kennel No. 14, ID No. LCAC-A-5479.
“Zeta” is a 1-year-old female pit bull terrier in kennel No. 16, ID No. LCAC-A-5427. Photo courtesy of Lake County Animal Care and Control. ‘Zeta’
“Zeta” is a 1-year-old female pit bull terrier with a black and tan coat.
She is in kennel No. 16, ID No. LCAC-A-5427.
“Jax” is a 4-year-old male Siberian husky in kennel No. 17, ID No. LCAC-A-5477. Photo courtesy of Lake County Animal Care and Control. ‘Jax’
“Jax” is a 4-year-old male Siberian husky with a black and white coat.
He is in kennel No. 17, ID No. LCAC-A-5477.
This 2-month-old female kelpie puppy is in kennel No. 18b, ID No. LCAC-A-5622. Photo courtesy of Lake County Animal Care and Control. Kelpie puppy
This 2-month-old female kelpie puppy has a black and tan coat.
She is in kennel No. 18b, ID No. LCAC-A-5622.
This 2-year-old male Chihuahua-terrier mix is in kennel No. 20, ID No. LCAC-A-5381. Photo courtesy of Lake County Animal Care and Control. Male Chihuahua-terrier mix
This 2-year-old male Chihuahua-terrier mix has a short white coat.
She is in kennel No. 20, ID No. LCAC-A-5381.
This 2-year-old male Chihuahua-terrier mix is in kennel No. 20, ID No. LCAC-A-5381. Photo courtesy of Lake County Animal Care and Control. Male shepherd
This 2-year-old male shepherd has a black and tan coat.
He is in kennel No. 22, ID No. LCAC-A-5423.
This 6-year-old female pit bull terrier is in kennel No. 24, ID No. LCAC-A-5410. Photo courtesy of Lake County Animal Care and Control. Female pit bull terrier
This 6-year-old female pit bull terrier has a short tan coat.
She is in kennel No. 24, ID No. LCAC-A-5410.
This 1-year-old male pit bull terrier is in kennel No. 25, ID No. LCAC-A-5628. Photo courtesy of Lake County Animal Care and Control. Male pit bull terrier
This 1-year-old male pit bull terrier has a short tan coat.
He is in kennel No. 25, ID No. LCAC-A-5628.
This 1-year-old male pit bull terrier is in kennel No. 25, ID No. LCAC-A-5628. Photo courtesy of Lake County Animal Care and Control. Male shepherd
This 1 and a half year old male shepherd has a short tricolor coat.
He is in kennel No. 26, ID No. LCAC-A-5424.
This 1-year-old male pit bull terrier is in kennel No. 25, ID No. LCAC-A-5628. Photo courtesy of Lake County Animal Care and Control. Female shepherd
This 2-year-old female shepherd has a short yellow and white coat.
She is in kennel No. 27, ID No. LCAC-A-5369.
This 3-year-old collie mix is in kennel No. 28, ID No. LCAC-A-5514. Photo courtesy of Lake County Animal Care and Control. Female collie mix
This 3-year-old collie mix has a black coat.
She is in kennel No. 28, ID No. LCAC-A-5514.
“Chance” is a 7-month-old male pit bull puppy in kennel No. 29, ID No. LCAC-A-5325. Photo courtesy of Lake County Animal Care and Control. ‘Chance’
“Spot” is a 7-month-old male pit bull puppy with a white coat.
He is in kennel No. 29, ID No. LCAC-A-5325.
“Nana” is a 2-year-old female shepherd in kennel No. 33, ID No. LCAC-A-5277. Photo courtesy of Lake County Animal Care and Control. ‘Nana’
“Nana” is a 2-year-old female shepherd mix with a short yellow coat.
She is in kennel No. 33, ID No. LCAC-A-5277.
This 10-month-old female shepherd is in kennel No. 34, ID No. LCAC-A-5323. Photo courtesy of Lake County Animal Care and Control. Female shepherd
This 10-month-old female shepherd has a tricolor coat.
She is in kennel No. 34, ID No. LCAC-A-5323.
“Jojo” is a one and a half year old female pit bull terrier in foster care, ID No. LCAC-A-5312. Photo courtesy of Lake County Animal Care and Control. ‘Jojo’
“Jojo” is a one and a half year old female pit bull terrier with a short tricolor coat.
She is in kennel foster care, ID No. LCAC-A-5312.
Email Elizabeth Larson at This email address is being protected from spambots. You need JavaScript enabled to view it.. Follow her on Twitter, @ERLarson, or Lake County News, @LakeCoNews.
LAKEPORT, Calif. — Sponsoring Survivorship is holding its 27th annual Breast Cancer Run & Walk on Saturday, Oct. 7.
The event will be held at Silveira Community Center on Main Street in Lakeport.
Registration is from 7 to 8:30 a.m. with a fun program of music, presentations, refreshments, raffles and more.
The event begins at 9 a.m. — rain or shine.
A beautiful birdhouse, handcrafted with love by Shannon Bauman, will be a grand prize for this year’s raffle. Contact Shannon or Julie Kelley (707-972-0286) to get your tickets today.
Sponsoring Survivorship helps women and men in their battle with breast cancer.
Special thanks to all the generous sponsors and individuals who have donated to Sponsoring Survivorship.
You too can get involved in supporting this vital effort.

 How to resolve AdBlock issue?