 How to resolve AdBlock issue?
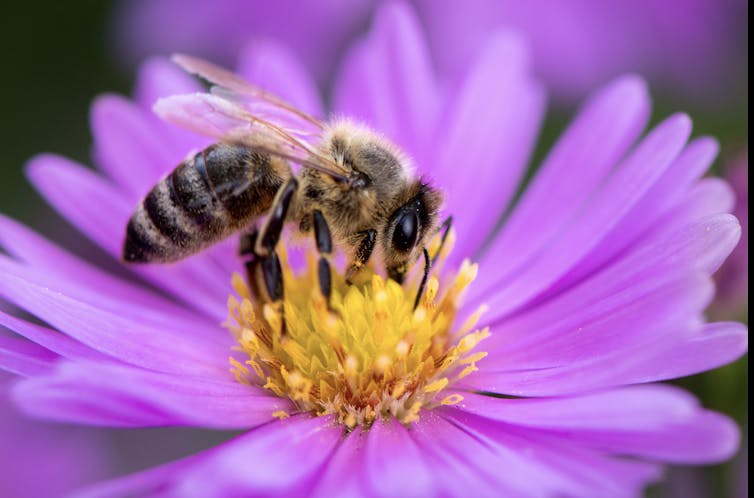
Many plants, from crops to carnations, cannot bear fruit or reproduce without bees, beetles, butterflies and other insects to pollinate them. But the population of insect pollinators is dropping in the U.S., due in part to pesticides, climate change, invasive plants and diminished habitats. Rachel Mallinger, assistant professor of entomology at the University of Florida, explains why these insects are in decline and how homeowners can create yards and gardens that are good for pollinators.
The Conversation has collaborated with SciLine to bring you highlights from the discussion that have been edited for brevity and clarity.
What kind of insects pollinate?
Rachel Mallinger: A lot of different insects pollinate. Insects visit flowers for many purposes, often for food, to get nectar or to get pollen. Sometimes they’ll visit flowers to mate or to lay eggs or as refuge. Bees are the primary pollinators for a lot of plants, but flies, wasps, beetles and butterflies also play an important role.
How ecologically critical are insect pollinators?
Mallinger: A small percentage of flowering plants are pollinated primarily by wind, but new research suggests that as much as 90% require animal pollinators. Although birds, bats and other mammals also pollinate, insects are the main pollinators for the vast majority of those plants.
Without insects and their pollination, these plants would not be able to reproduce, and we would see a dramatic decline in plant diversity and abundance. Without insect pollinators, these plants wouldn’t produce the seeds and the fruit that feed many animals – including people.
Have insect pollinator populations declined?
Mallinger: Recent studies have shown pretty dramatic declines in insects generally, and this has been shown even in conservation lands. So we think that in highly developed areas, insect declines are probably even more dramatic.
I study primarily native wild bees. Here in North America, we have between 4,000 and 5,000 species. For many species, we don’t know if they’re declining. Of the ones that we do have some information on, it’s estimated that about half are declining and about a quarter are imperiled and potentially on the road to going extinct.
The insect pollinators that tend to be most at risk are ones that are specialists – those that require really unique, specialized food or nesting resources. Also ones that already have a limited range. For example, maybe they are found only on islands or in a small area.
What about the economic importance of insect pollinators?
Mallinger: Crops pollinated by animals, primarily insects, make up about one-third of our agricultural production in terms of acreage. A study in the state of Georgia found over US$360 million per year in crop pollination services provided by insects in that state alone.
What do insect pollinators need to be healthy?
Mallinger: Aside from pollen and nectar, some insect pollinators require additional food sources. For example, butterflies in the caterpillar stage need foliage from their host plants.
Other insect pollinators, like wasps and flies, are carnivores in the larval stage, so during that time they need to eat small arthropods – like spiders and centipedes – and insects.
Beyond that, they need nesting habitat. The majority of our insect pollinators nest below ground, and so they need ground that is relatively undisturbed, bare and accessible. Other pollinators nest in woody debris, stems and reeds. And some pollinators, like butterflies, just lay their eggs on host plants.
Additionally, pollinators need environments that are free from toxins. So they need environments that are not regularly sprayed with pesticides, including insecticides.
What stressors are leading to declines in insect pollinator populations?
Mallinger: I would say there are five main stressors.
Land use change is one. This can be the conversion of wild lands to agriculture or to development.
Climate change is another stressor. It changes the average temperature that these pollinators are experiencing and increases the chance of extreme temperatures and weather events. Hurricanes and flooding can be really detrimental and destroy the habitat for pollinators.
Third, pesticides and other chemicals in our environment that are toxic.
Invasive plants can be really detrimental for pollinators. They can take over an area and replace the native plants that pollinators depend on. That’s four.
And finally, pathogens and parasites.
All five of these stressors can interact. For example, climate change may increase the likelihood of invasive plant species, pathogens and parasites thriving. Land use change can also increase the likelihood of invasive species.
What can homeowners do to help pollinators?
Mallinger: Planting a diversity of flowering plants for pollinators is one of the best things you can do. Aim to have at least three plants flowering at any given time, and look for a diversity of flower colors and shapes. Different pollinators have different preferences. You can have flowers that are yellow, blue, purple, pink, red and white.
In terms of floral shapes, plant some flowers that are flat and are accessible for pollinators with small mouthparts. And also plant some flowers with medium-length tubes, and some with long tubes.
Focus on native plants and try to seek out plants that might not just be the common types that you find in the big box stores. Go to native plant nurseries and seek out resources online.
Additionally, try to have nesting habitat in your garden. If the space allows, have some woody debris around for the pollinators that nest above ground. This can include things like logs, stems and reeds. Also manage your area to be as chemical-free as possible. This includes reducing pesticide use.
Keep in mind that many pollinators that nest below ground are not aggressive and are solitary. It’s just one individual pollinator and her nest.
Watch the full interview to hear more.
SciLine is a free service based at the American Association for the Advancement of Science, a nonprofit that helps journalists include scientific evidence and experts in their news stories.![]()
Rachel Mallinger, Professor of Entomology, University of Florida
This article is republished from The Conversation under a Creative Commons license. Read the original article.