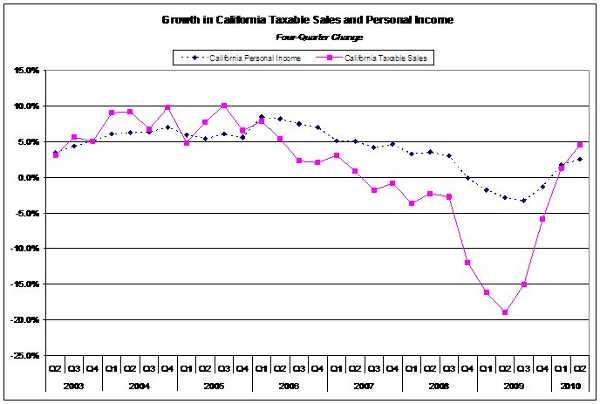
The State Board of Equalization has reported that taxable sales in California totaled $118.5 billion in the second quarter of 2010, up $5.2 billion, a 4.6 percent increase from the same quarter the previous year.
California taxable sales rose faster than personal income for the first time since 2005.
Additionally, more recent data indicate that a more pronounced recovery in taxable sales continues in second quarter 2011.
BOE’s estimate of statewide taxable sales for the second quarter of 2011, based on cash receipts, shows that taxable sales are estimated to have risen 9 percent in the second quarter of 2011 over the same period a year earlier.
“The latest report shows many positive signs,” said Betty T. Yee, who represents the First District on the Board of Equalization, which includes Lake County. “The statewide taxable sales show signs of growth. But success will depend on continued economic expansion throughout the year.”
The second quarter 2010 taxable sales report shows regionally that the nine-county San Francisco Bay Area had the strongest growth, rising 6.6 percent, while the region’s major cities varied widely, for example, San Jose increased 10.7 percent, San Francisco rose 7.1 percent, while Oakland increased by 1.6 percent in second quarter 2010.
The second quarter 2010 taxable sales report shows that most counties in the First Equalization District had increases in taxable sales, including the counties of Humboldt (+13.3%), Santa Clara (+12.3%), Monterey (+7.7%), San Francisco (+7.1%), Marin (+6.8%), San Mateo (+6.4%), Alameda (+6.1%), Yolo (+5.7%), Santa Cruz (+3.4%), Sonoma (+3.2%), Napa (+3.0%), Santa Barbara (+2.9%), San Benito (+2.5%), Mendocino (+2.0) and Contra Costa (+0.9%).
Conversely, in the second quarter 2010, some counties in the First Equalization District saw taxable sales decline including the counties of Trinity (-6.5%), Lake (-3.9%), San Luis Obispo (-3.5%), Del Norte (-3.1%) and Solano (-2.9 %).
In constant dollar terms, taxable sales increased 2.5 percent from the same quarter the previous year. The California Taxable Sales Deflator, which measures the rate of change of all taxable sales in the state, was up 2.0 percent. In comparison, the California Consumer Price Index, which measures the rate of change of common consumer goods, was up 1.8 percent.
California gasoline station sales in the second quarter of 2010 increased 15.5 percent, the largest gain of any major category. Most of this growth is attributable to an increase in the price of gasoline. The average price of gasoline at the pump increased 19.4 percent during the second quarter of 2010, while gasoline consumption for the same period increased only 0.9 percent.
Second quarter 2010 taxable sales by California motor vehicle and parts dealers increased 13.3 percent. Most of that gain is attributable to both new car dealers that increased 16.6 percent and used car dealers that increased 11.4 percent.
Other motor vehicle dealer sales that include RVs, motorcycles, boats, and aircraft, decreased by 2.2 percent, this might possibly be due to Californians having less “disposable income” in the second quarter of 2010.
Taxable sales made by electronic and appliance store sales did well during the second quarter of 2010, growing 7.9 percent from a year ago, with most of that increase due to sales from computer and software stores, which grew at 13.4 percent during the second quarter of 2010 in California.
The second quarter of 2010 taxable sales report shows that sales from “all other outlets” (comprised primarily of manufacturing and wholesale businesses in California) grew at a sluggish 2.9 percent, buoyed by wholesale trade that grew 5.8 percent, and manufacturing that had 8.3 percent growth. Growth in this period was constrained mainly by real estate and rental leasing (that declined 1.6 percent) and construction (declining 0.7 percent).
Furniture and home furnishings stores showed a modest growth in sales over the same quarter a year ago at 4.3 percent, mostly due to furniture store sales growing 6.7 percent, while the home furnishings segment grew only 0.8 percent in California during the second quarter of 2011.
General merchandise store sales, which represent the largest non-durable retail category, showed virtually no growth for the second quarter of 2010.
Taxable Sales in California is a quarterly report on retail sales activity in California, as measured by transactions subject to sales and use tax. It includes data about statewide taxable sales by type of business, as well as data about taxable sales in all California cities and counties. To view all taxable sales in California, visit: www.boe.ca.gov/news/tsalescont.htm.
To view the second quarter of 2010 taxable sales in California, visit www.boe.ca.gov/news/tsalescont10.htm.

 How to resolve AdBlock issue?


