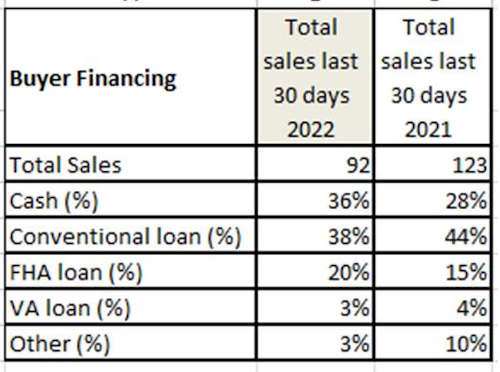
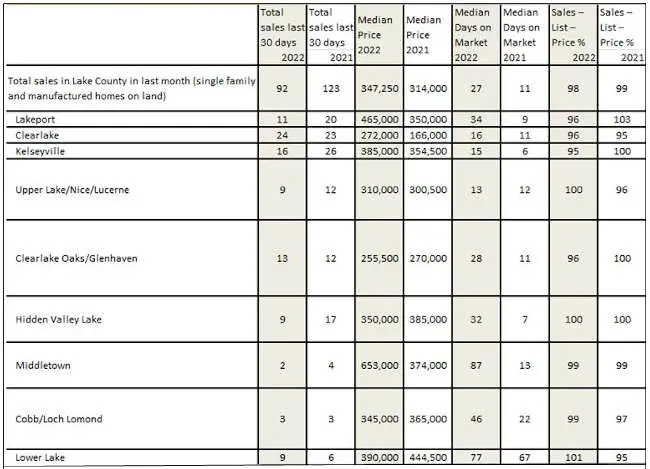
Over the last 30 days, 92 homes have sold through the multiple listing service, compared to 123 during the same time last year.
Those houses sold include traditionally built “stick-built” houses as well as manufactured homes on land.
There were 11 sales of mobile homes in parks compared to nine for the same time last year, and 32 bare land (lots and acreage) sales, compared with 45 for the same time last year.
Total percentage of homes bought for all cash was 33%, compared to 35% for the same time last year. Of those, 35% were financed by Fannie Mae or Freddie Mac and are considered “conventional loans,” compared to 54% for the same time last year.
Another 18% were financed by FHA, the same as last year this time, and 3% had other financing such as private loans or seller financed notes compared to 12% for the same time last year.

There are 403 homes on the market right now. If the rate of sales stays the same at 92 homes sold per month, there are currently 4.4 months of inventory on the market at the moment. That means that if no new homes are brought to the market for sale, in 4.4 months all of these homes would be sold and there would be none available.
Less than six months of inventory is generally considered to be a “sellers’ market” while more than six months of inventory is often called a “buyers’ market.” This is the largest inventory we have seen in the past two years.
Most homes were selling very close to the asking price, at an average of 98% of the asking price. This is in contrast to other areas, where homes sell for more than the asking price.
The median time on the market last month was 27 days, compared to 11 days for this time last year.
The median price of a single family home in Lake County over the last 30 days was $347,250 compared to $314,000 during this time period last year.
In the past 30 days, 29% of homes sold had seller concessions for an average of $7,629; a year ago 28% of homes sold had an average seller concession of $6,510.
A more detailed breakdown by the different areas is shown in the chart below.


 How to resolve AdBlock issue?


